We have our last true “Wildcard” race of the season this weekend with the second Talladega event of 2019. Being successful in DraftKings at these big superspeedways always come down to one thing and one thing only: place differential. In a way, have to throw our conventional thinking away when it comes to Daytona and Talladega, and we’ll get to that here in the Strategy Breakdown.
One statistic to note: the last five Talladega winners have started 11th or higher.
Here are the links to the qualifying results and practice speeds from this weekend:
DraftKings Strategy Breakdown for the Talladega 2
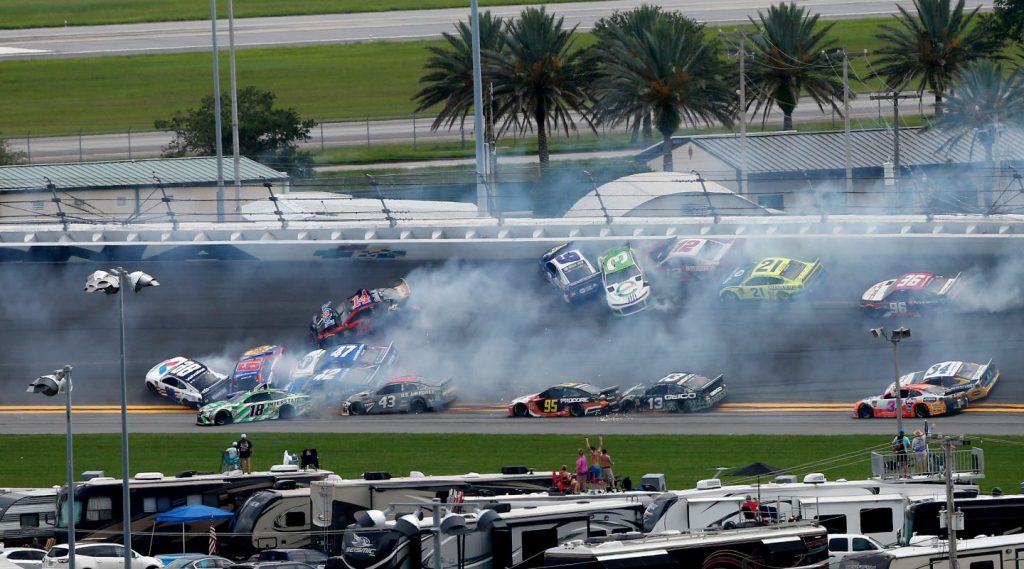
The image above is what we saw the last time we raced at a superspeedway track. Obviously with Talladega and Daytona, the chances of having a 10+ car wreck are infinitely higher than most tracks, but this one was a little different, because it basically took out the entire field of actual contenders. Yes, these tracks are where the little guys do actually have a chance of finishing up front, but typically it’s only one or two. What we were left at Daytona earlier this year was Justin Haley in victory lane and guys like Corey LaJoie, Matt Tifft, Landon Cassill, and J.J. Yeley all coming home in the top 12 as well. In my mind, it wasn’t normal, and I wouldn’t let that sway you on how you build your DraftKings lineups this weekend.
Here’s the thing: the fall race at Talladega always seems to be the most tame of the four. Last year, 28 cars finished on the lead lap in this race, and in 2016 a whopping 34 cars ended up on the lead lap. In 2015, 27 cars were on the lead lap at the end. In all, over the last seven years, all but one of the Talladega fall races ended with 30+ drivers within one lap of the leader.
Yes, guys like Rick Allen love to hype this race up as the “last chance” for a driver to steal a win and advance to the next round of the Playoffs, but let’s take a step back and realize, one, how stupid Rick Allen is and, two, it’s his job to hype up the broadcast.
The fact of the matter is that Martin Truex, Jr., Denny Hamlin, Kyle Busch, and Kevin Harvick all have 40+ cushions going in to Sunday, and they’re not going to jeopardize that by making some crazy move to win the race. Kyle Larson is locked in to the next round and isn’t going to do anything crazy that would piss off his competitors. Brad Keselowski (+20) and Alex Bowman (+17) will both be playing it safe, and then you have William Byron, Joey Logano, Clint Bowyer, and Chase Elliott all on the bubble for the next round–all of which will be points racing on Sunday.
The only Playoff driver that is in a deep hole heading into this race is Ryan Blaney, and he’s not the type of guy to drive like an asshole. And the non-Playoff drivers? Yeah, they’re not going to ruin some team’s season by driving over their head, either. In all, it’s very unlikely to happen.
Strategy-wise, I’m sticking to my typical “restrictor plate” method of building DraftKings lineups this weekend:
- Top 5 starting spot: almost never
- Top 10 starting spot: maybe one driver, absolute max of two
- 11th-24th starting spot: two or three drivers
- 25th-40th starting spot: two or three drivers
Remember: the optimal lineup almost never uses anywhere near the full $50,000 in salary cap space!
Driver Performance at Talladega & Daytona in 2019
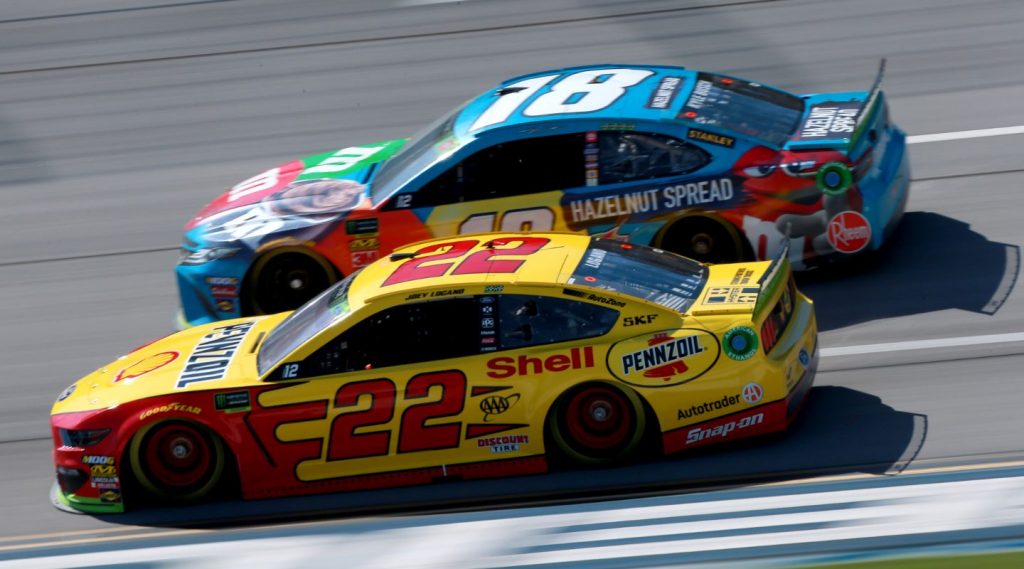
Below you will find the basic statistical data for drivers at the superspeedways this year. So included in this data set is the Daytona 500, the first Talladega race, and the second Daytona race in July. This table is sorted by average finish by default, but you can sort by whatever you want by clicking on the headers.
| Driver | DK Salary | Avg. Finish | Avg. Run Pos | Finish / Run Pos Comparison (ARP - Finish) | Avg. Start | Avg. Driver Rating |
|---|---|---|---|---|---|---|
| Kyle Busch | $10,900 | 08.67 | 09.67 | 01.00 | 18.33 | 98.50 |
| Ryan Newman | $7,300 | 08.67 | 20.33 | 11.67 | 20.33 | 73.13 |
| Ty Dillon | $6,800 | 09.00 | 18.33 | 09.33 | 19.33 | 77.60 |
| Joey Logano | $9,400 | 11.00 | 08.67 | -02.33 | 04.33 | 100.13 |
| Alex Bowman | $8,400 | 11.33 | 11.00 | -00.33 | 06.67 | 89.27 |
| Corey Lajoie | $5,500 | 11.67 | 28.33 | 16.67 | 32.67 | 58.80 |
| Kurt Busch | $8,800 | 13.67 | 19.67 | 06.00 | 11.33 | 75.50 |
| Ryan Preece | $6,100 | 14.33 | 21.67 | 07.33 | 25.67 | 67.90 |
| William Byron | $8,600 | 14.67 | 11.00 | -03.67 | 12.67 | 97.23 |
| Erik Jones | $8,100 | 15.00 | 15.67 | 00.67 | 24.00 | 78.57 |
| Jimmie Johnson | $8,200 | 15.00 | 19.67 | 04.67 | 17.33 | 75.30 |
| Aric Almirola | $7,600 | 16.00 | 14.33 | -01.67 | 07.00 | 86.57 |
| Kyle Larson | $9,800 | 17.00 | 15.67 | -01.33 | 16.33 | 76.60 |
| Chase Elliott | $10,100 | 17.67 | 10.33 | -07.33 | 12.00 | 93.13 |
| Reed Sorenson | $4,900 | 18.00 | 28.00 | 10.00 | 37.00 | 54.50 |
| Daniel Hemric | $6,400 | 19.00 | 20.00 | 01.00 | 19.33 | 68.27 |
| Michael McDowell | $5,900 | 19.33 | 25.33 | 06.00 | 24.67 | 56.23 |
| Paul Menard | $7,000 | 20.33 | 16.67 | -03.67 | 14.67 | 74.87 |
| Ricky Stenhouse Jr | $7,500 | 20.67 | 10.67 | -10.00 | 10.00 | 88.17 |
| Brendan Gaughan | $5,700 | 21.00 | 30.50 | 09.50 | 34.50 | 45.45 |
| Austin Dillon | $7,100 | 21.00 | 16.00 | -05.00 | 14.00 | 76.20 |
| Denny Hamlin | $10,300 | 21.00 | 19.33 | -01.67 | 13.00 | 68.50 |
| Brad Keselowski | $9,600 | 21.33 | 15.00 | -06.33 | 14.00 | 83.43 |
| Ross Chastain | $5,600 | 22.00 | 31.67 | 09.67 | 36.00 | 43.47 |
| Matt DiBenedetto | $7,900 | 22.33 | 15.67 | -06.67 | 20.00 | 86.80 |
| Landon Cassill | $5,200 | 23.00 | 30.00 | 07.00 | 30.67 | 48.67 |
| Parker Kligerman | $4,800 | 24.33 | 27.00 | 02.67 | 32.00 | 49.50 |
| Martin Truex Jr | $10,700 | 25.67 | 16.00 | -09.67 | 12.00 | 76.47 |
| Joey Gase | $5,100 | 27.00 | 36.00 | 09.00 | 40.00 | 34.00 |
| Matt Tifft | $5,300 | 27.33 | 28.67 | 01.33 | 27.33 | 45.60 |
| Ryan Blaney | $9,000 | 27.33 | 11.00 | -16.33 | 10.33 | 82.40 |
| Clint Bowyer | $9,200 | 27.67 | 20.00 | -07.67 | 08.33 | 64.13 |
| Chris Buescher | $6,600 | 28.00 | 22.67 | -05.33 | 22.67 | 65.33 |
| Daniel Suarez | $7,700 | 28.33 | 17.67 | -10.67 | 18.00 | 73.83 |
| David Ragan | $5,400 | 30.33 | 21.00 | -09.33 | 22.00 | 69.50 |
| Bubba Wallace | $6,200 | 30.67 | 31.00 | 00.33 | 23.33 | 51.47 |
| Kevin Harvick | $10,500 | 31.00 | 21.00 | -10.00 | 08.67 | 67.23 |
Talladega 2 1000Bulbs.com 500 DraftKings Statistical Breakdown
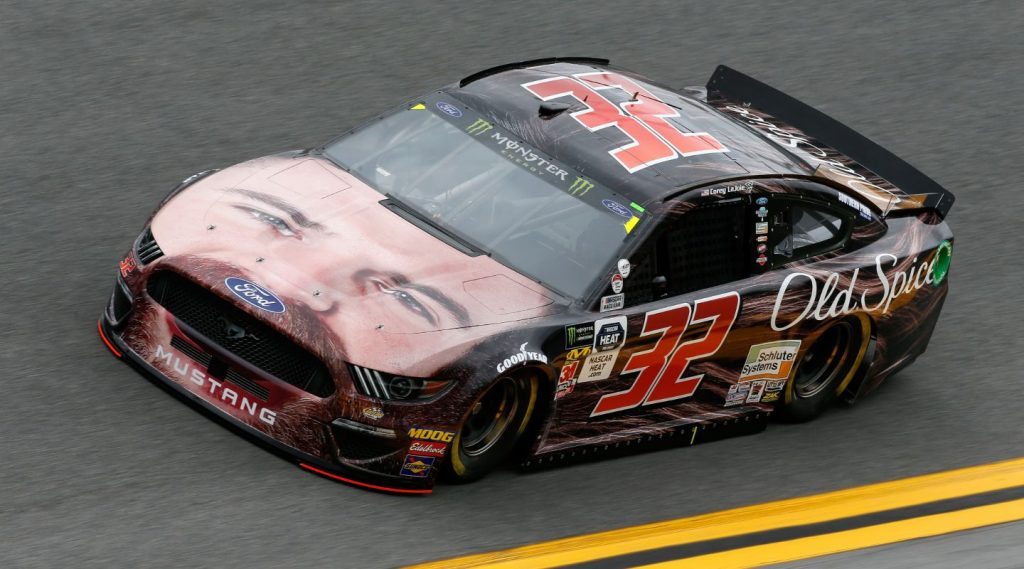
With this chart, we get into the statistics that DraftKings players want to see. Again, the races included in this data set is the Daytona 500, the first Talladega race, and the second Daytona race in July. This table is sorted by average DraftKings points per race by default, but you can sort by whatever you want by clicking on the headers.
| Driver | DK Salary | DK Pts Per Race | DK Dominator Pts Per Race | Fastest Laps Per Race | Laps Led Race |
|---|---|---|---|---|---|
| Corey Lajoie | $5,500 | 54.17 | 00.83 | 01.67 | 00.00 |
| Kyle Busch | $10,900 | 51.83 | 06.83 | 06.33 | 14.67 |
| Ryan Newman | $7,300 | 51.33 | 04.33 | 08.67 | 00.00 |
| Ty Dillon | $6,800 | 48.75 | 03.42 | 05.67 | 02.33 |
| Reed Sorenson | $4,900 | 46.50 | 01.50 | 03.00 | 00.00 |
| Ryan Preece | $6,100 | 43.25 | 02.25 | 04.33 | 00.33 |
| Erik Jones | $8,100 | 41.50 | 03.50 | 06.33 | 01.33 |
| Ross Chastain | $5,600 | 37.92 | 01.92 | 02.33 | 03.00 |
| Brendan Gaughan | $5,700 | 37.25 | 00.75 | 01.50 | 00.00 |
| Joey Logano | $9,400 | 35.17 | 08.83 | 03.00 | 29.33 |
| Jimmie Johnson | $8,200 | 33.67 | 02.33 | 04.67 | 00.00 |
| William Byron | $8,600 | 32.83 | 05.50 | 03.67 | 14.67 |
| Kurt Busch | $8,800 | 31.83 | 03.83 | 06.33 | 02.67 |
| Michael McDowell | $5,900 | 31.17 | 01.17 | 02.00 | 00.67 |
| Landon Cassill | $5,200 | 30.50 | 01.83 | 03.67 | 00.00 |
| Alex Bowman | $8,400 | 30.33 | 02.33 | 03.33 | 02.67 |
| Joey Gase | $5,100 | 30.00 | 00.00 | 00.00 | 00.00 |
| Parker Kligerman | $4,800 | 28.67 | 01.33 | 02.67 | 00.00 |
| Kyle Larson | $9,800 | 28.25 | 01.92 | 03.67 | 00.33 |
| Daniel Hemric | $6,400 | 27.92 | 02.58 | 05.00 | 00.33 |
| Matt DiBenedetto | $7,900 | 27.50 | 08.17 | 08.00 | 16.67 |
| Chase Elliott | $10,100 | 27.42 | 05.75 | 03.67 | 15.67 |
| Aric Almirola | $7,600 | 22.08 | 03.08 | 01.67 | 09.00 |
| Austin Dillon | $7,100 | 21.50 | 05.50 | 03.33 | 15.33 |
| Denny Hamlin | $10,300 | 19.75 | 03.75 | 01.67 | 11.67 |
| Paul Menard | $7,000 | 19.58 | 01.58 | 03.00 | 00.33 |
| Brad Keselowski | $9,600 | 17.67 | 02.33 | 03.00 | 03.33 |
| Matt Tifft | $5,300 | 17.67 | 01.00 | 02.00 | 00.00 |
| Ricky Stenhouse Jr | $7,500 | 17.33 | 04.67 | 03.67 | 11.33 |
| Chris Buescher | $6,600 | 11.58 | 00.92 | 01.67 | 00.33 |
| Bubba Wallace | $6,200 | 08.17 | 02.17 | 04.33 | 00.00 |
| David Ragan | $5,400 | 08.00 | 02.67 | 05.33 | 00.00 |
| Martin Truex Jr | $10,700 | 07.25 | 02.58 | 03.33 | 03.67 |
| Daniel Suarez | $7,700 | 07.17 | 01.83 | 03.67 | 00.00 |
| Ryan Blaney | $9,000 | 02.50 | 02.83 | 02.67 | 06.00 |
| Clint Bowyer | $9,200 | -01.42 | 01.58 | 02.67 | 01.00 |
| Kevin Harvick | $10,500 | -07.33 | 02.00 | 02.00 | 04.00 |


