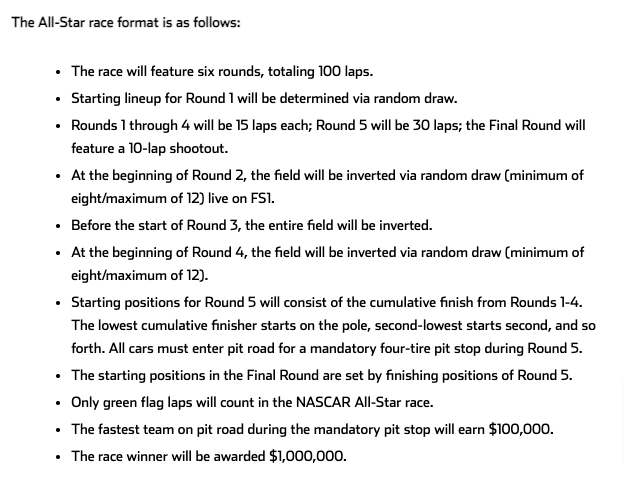
The NASCAR Cup Series All Star Race is at Texas Motor Speedway this Sunday evening, and the format is a doozy. First up is the All Star Open race, which is 50 laps and three Stages (20-20-10). The winner of each of those Stages will earn a spot into the All Star Race later that night. Also, there will be a “fan vote” winner that will be awarded a spot in the All Star Race. Currently, there are 17 drivers locked into the “finale” race, so those additional four will give us a total of 21 vying for the $1,000,000 prize. The All Star Race will be 100 laps in length and consist of six Stages (essentially). Here’s how things will play out through the night to crown an All Star Champion (screenshot via Jayski):
If you’d like to support the site you can do so by donating here.
How the algorithm works: There are quite a few statistics that go into the Power Index formula, including recent performance both overall and at this week’s track specifically, similar track performance, projected strength of the car, practice speeds (when applicable), starting position, and a few other variables.
Before We Get To The Algorithm Results…
The Last 3 Entrants – As mentioned above, we won’t know the final three entrants in the All Star Race until right before it starts. They will be the winners of the three Stages of the Open race, and then the winner of the fan vote. The algorithm predicted finishing order below only has the 17 drivers that were initially guaranteed a spot in the race shown. On Sunday, I will re-run the algorithm with the additional four drivers from the Open and fan vote, and update this post. Please note the Power Index numbers may change a bit with this change, as it will be essentially adding additional drivers to the pool.
Texas All Star Race Algorithm Predicted Finishing Order
| Rank | Driver | Power Index |
| 1. | Busch, Kyle | 28.70 |
| 2. | Larson, Kyle | 28.15 |
| 3. | Byron, William | 27.73 |
| 4. | Truex, Jr., Martin | 25.53 |
| 5. | Elliott, Chase | 25.42 |
| 6. | Harvick, Kevin | 24.63 |
| 7. | Blaney, Ryan | 24.34 |
| 8. | Keselowski, Brad | 23.54 |
| 9. | Hamlin, Denny | 21.00 |
| 10. | Logano, Joey | 19.44 |
| 11. | Bowman, Alex | 18.70 |
| 12. | Dillon, Austin | 11.06 |
| 13. | Reddick, Tyler | -10.11 |
| 14. | Bell, Christopher | -16.72 |
| 15. | Busch, Kurt | -20.70 |
| 16. | DiBenedetto, Matt | -24.14 |
| 17. | Chastain, Ross | -25.18 |
| 18. | Newman, Ryan | -29.87 |
| 19. | Almirola, Aric | -31.38 |
| 20. | Custer, Cole | -34.38 |
| 21. | McDowell, Michael | -35.74 |






It seems to me this format would encourage big-time sandbagging in rounds 1-4. With the lowest cumulative performance starting up front for round 5 NASCAR might have to black flag every car for failing to meet minimum speed. Who is the person responsible for the final go-ahead on this? I need a name.
Actually it’s the opposite. The lowest cumulative finishes would mean that you have to finish up front to get a lower total, so it completely discourages sandbagging or trying to game the system.