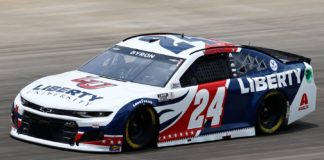
The Bank of America ROVAL 400 is on Sunday at Charlotte, and this will be our seventh and final road course race of the season. When it comes to DFS and road courses, you kind of have to take a bit more different of an approach than normal because there aren’t many dominator points up for grabs as usual, which puts a bigger emphasis on place differential and finishing position. Additionally, we have a ton of chalk place differential plays coming up on Sunday thanks, mainly, to the Talladega race last weekend and the qualifying formula.
Make sure you check out this week’s episode of the Stacking Dennys podcast featuring RotoDoc and myself. This week’s episode was a very good one breaking down Sunday’s race. Click here to tune in. Now let’s goooo!!!!
Enjoy the FREE content that this site offers each week? Consider donating to support by clicking here. Also, be sure to check out the Algorithm Predicted Finishing Order for this race by clicking here!
Speed Report & Loop Data Driver Averages
We’re focusing on road course tracks specifically this weekend. So far in 2021, we have raced at the Daytona Road Course, COTA, Sonoma, Road America, Watkins Glen, and Indy Road Course. With how crazy the Indy Road Course was, I’m not even including it in my data set this weekend. Below you will find Driver Averages for the other five races, as well as a second table that takes COTA out of the equation since it was ran in the rain. The following statistics are included in these tables:
- Starts
- Finish
- ARP = average running position
- DR = driver rating
- FL = fastest laps (total)
- LL = laps led (total)
- T15 = laps ran inside top 15 (total)
- Total Laps = laps completed (total)
2021 Driver Averages At Road Courses (Minus Indy Road Course)
| Chase Elliott | 5 | 05.4 | 08.1 | 121.7 | 69 | 86 | 301 | 368 |
| Denny Hamlin | 5 | 07.0 | 09.4 | 101.5 | 20 | 13 | 303 | 368 |
| Joey Logano | 5 | 09.2 | 10.5 | 99.7 | 8 | 40 | 287 | 368 |
| Kyle Larson | 5 | 10.0 | 05.9 | 117.6 | 54 | 88 | 346 | 368 |
| Kurt Busch | 5 | 10.8 | 11.3 | 92.4 | 3 | 12 | 263 | 368 |
| Kyle Busch | 5 | 11.4 | 10.2 | 106.7 | 12 | 18 | 282 | 367 |
| Martin Truex Jr | 5 | 12.4 | 08.6 | 104.7 | 26 | 38 | 287 | 338 |
| AJ Allmendinger | 3 | 13.7 | 16.1 | 84.6 | 7 | 2 | 87 | 186 |
| Ross Chastain | 5 | 13.8 | 12.9 | 89.9 | 5 | 4 | 249 | 324 |
| Alex Bowman | 5 | 13.8 | 14.6 | 82.2 | 3 | 3 | 197 | 368 |
| Chase Briscoe | 5 | 14.0 | 16.5 | 77.0 | 0 | 0 | 181 | 368 |
| Christopher Bell | 5 | 14.4 | 12.5 | 91.6 | 25 | 5 | 246 | 332 |
| Chris Buescher | 5 | 15.0 | 17.1 | 72.5 | 1 | 0 | 147 | 368 |
| Ryan Blaney | 5 | 15.2 | 18.1 | 72.6 | 1 | 0 | 145 | 368 |
| Tyler Reddick | 5 | 16.8 | 15.5 | 78.7 | 5 | 5 | 194 | 356 |
| Austin Dillon | 5 | 17.0 | 17.3 | 72.3 | 0 | 0 | 179 | 367 |
| Brad Keselowski | 5 | 17.4 | 18.7 | 69.7 | 0 | 9 | 147 | 365 |
| Erik Jones | 5 | 17.4 | 19.8 | 65.8 | 1 | 0 | 106 | 367 |
| Michael McDowell | 5 | 18.8 | 18.6 | 72.1 | 3 | 3 | 125 | 368 |
| Aric Almirola | 5 | 20.0 | 18.8 | 63.5 | 0 | 1 | 123 | 368 |
| Kevin Harvick | 5 | 20.0 | 14.6 | 73.4 | 3 | 0 | 200 | 333 |
| Matt DiBenedetto | 5 | 20.8 | 16.4 | 74.7 | 5 | 10 | 190 | 363 |
| Cole Custer | 5 | 20.8 | 18.9 | 63.7 | 0 | 0 | 118 | 338 |
| Ryan Preece | 5 | 21.4 | 21.4 | 57.5 | 3 | 2 | 73 | 311 |
| Ricky Stenhouse Jr | 5 | 21.6 | 22.5 | 58.1 | 2 | 1 | 60 | 316 |
| Corey LaJoie | 5 | 22.8 | 22.8 | 53.0 | 0 | 0 | 73 | 368 |
| William Byron | 5 | 23.6 | 13.6 | 83.5 | 12 | 20 | 251 | 351 |
| Bubba Wallace | 5 | 25.2 | 25.1 | 55.6 | 0 | 0 | 77 | 332 |
| Daniel Suarez | 5 | 25.6 | 25.6 | 56.7 | 5 | 2 | 69 | 349 |
| Ryan Newman | 5 | 26.8 | 23.5 | 47.7 | 0 | 0 | 51 | 367 |
| Anthony Alfredo | 5 | 26.8 | 26.4 | 45.9 | 0 | 0 | 35 | 347 |
| James Davison | 5 | 28.4 | 29.9 | 41.3 | 0 | 0 | 10 | 319 |
| Justin Haley | 4 | 29.5 | 27.7 | 40.7 | 0 | 0 | 20 | 233 |
| Josh Bilicki | 5 | 30.2 | 30.1 | 38.8 | 0 | 0 | 7 | 364 |
| Cody Ware | 4 | 30.5 | 30.0 | 39.8 | 0 | 0 | 9 | 269 |
| Garrett Smithley | 4 | 30.8 | 32.4 | 31.8 | 0 | 0 | 0 | 303 |
| Austin Cindric | 2 | 31.5 | 16.8 | 80.6 | 1 | 6 | 56 | 89 |
| Quin Houff | 5 | 35.2 | 33.2 | 27.6 | 0 | 0 | 0 | 260 |
2021 Driver Averages At Road Courses (Minus COTA & Indy Road Course)
| Denny Hamlin | 4 | 05.3 | 08.5 | 108.3 | 20 | 13 | 273 | 314 |
| Chase Elliott | 4 | 06.5 | 08.1 | 121.9 | 57 | 81 | 256 | 314 |
| Martin Truex Jr | 4 | 06.8 | 07.3 | 112.3 | 26 | 35 | 274 | 314 |
| Kurt Busch | 4 | 06.8 | 11.2 | 96.4 | 3 | 12 | 227 | 314 |
| Christopher Bell | 4 | 08.5 | 11.5 | 101.6 | 24 | 5 | 233 | 314 |
| Joey Logano | 4 | 10.8 | 11.2 | 93.5 | 6 | 26 | 238 | 314 |
| Kyle Busch | 4 | 11.8 | 10.8 | 104.7 | 3 | 6 | 237 | 313 |
| Kyle Larson | 4 | 12.0 | 05.7 | 116.3 | 51 | 84 | 297 | 314 |
| Ryan Blaney | 4 | 14.8 | 17.3 | 75.0 | 1 | 0 | 131 | 314 |
| Alex Bowman | 4 | 15.3 | 14.6 | 80.9 | 3 | 0 | 164 | 314 |
| Chris Buescher | 4 | 15.5 | 17.3 | 71.5 | 1 | 0 | 114 | 314 |
| Kevin Harvick | 4 | 15.8 | 13.5 | 83.7 | 3 | 0 | 200 | 314 |
| Chase Briscoe | 4 | 16.0 | 17.2 | 73.0 | 0 | 0 | 138 | 314 |
| Ross Chastain | 4 | 16.3 | 13.5 | 84.9 | 2 | 0 | 206 | 270 |
| Cole Custer | 4 | 17.0 | 18.0 | 69.2 | 0 | 0 | 117 | 314 |
| Brad Keselowski | 4 | 17.0 | 18.1 | 72.9 | 0 | 9 | 135 | 311 |
| Erik Jones | 4 | 17.8 | 19.7 | 65.8 | 1 | 0 | 94 | 313 |
| AJ Allmendinger | 2 | 18.0 | 17.1 | 80.6 | 6 | 2 | 54 | 132 |
| Austin Dillon | 4 | 18.3 | 17.0 | 73.3 | 0 | 0 | 158 | 313 |
| Aric Almirola | 4 | 18.5 | 18.2 | 66.7 | 0 | 1 | 116 | 314 |
| Tyler Reddick | 4 | 18.8 | 15.7 | 79.4 | 5 | 5 | 166 | 302 |
| Matt DiBenedetto | 4 | 20.3 | 16.3 | 76.4 | 5 | 10 | 167 | 309 |
| Ricky Stenhouse Jr | 4 | 21.5 | 22.7 | 57.2 | 1 | 1 | 40 | 262 |
| Michael McDowell | 4 | 21.8 | 19.9 | 63.1 | 1 | 0 | 89 | 314 |
| Bubba Wallace | 4 | 21.8 | 24.8 | 52.5 | 0 | 0 | 66 | 314 |
| Ryan Preece | 4 | 23.0 | 23.4 | 52.0 | 3 | 0 | 36 | 257 |
| Corey LaJoie | 4 | 23.5 | 23.5 | 50.5 | 0 | 0 | 52 | 314 |
| Daniel Suarez | 4 | 23.8 | 24.2 | 58.6 | 5 | 2 | 69 | 303 |
| Justin Haley | 3 | 26.0 | 27.2 | 42.9 | 0 | 0 | 17 | 221 |
| William Byron | 4 | 26.8 | 12.7 | 83.7 | 12 | 20 | 225 | 297 |
| Ryan Newman | 4 | 27.5 | 23.7 | 47.9 | 0 | 0 | 39 | 313 |
| James Davison | 4 | 28.3 | 29.4 | 40.3 | 0 | 0 | 9 | 265 |
| Anthony Alfredo | 4 | 29.0 | 27.3 | 42.7 | 0 | 0 | 28 | 293 |
| Cody Ware | 3 | 30.0 | 30.6 | 35.6 | 0 | 0 | 5 | 216 |
| Josh Bilicki | 4 | 30.3 | 30.2 | 36.1 | 0 | 0 | 6 | 310 |
| Garrett Smithley | 3 | 31.7 | 33.3 | 29.9 | 0 | 0 | 0 | 249 |
| Quin Houff | 4 | 35.5 | 33.2 | 26.9 | 0 | 0 | 0 | 222 |
| Austin Cindric | 1 | 38.0 | 26.7 | 86.5 | 1 | 2 | 19 | 35 |
DraftKings Strategy & Dominators for Charlotte ROVAL
This is a road course race, which means we’re focusing mainly on place differential and finishing position for DraftKings. Yes, there are going to be some dominator points, but with only 109 laps, it’s well below the usual amount from a “normal” race.
- There are only 109 laps scheduled for Sunday’s Bank of America ROVAL 400, so there aren’t going to be too many dominator points. We should focus mainly on finishing position and place differential. For laps led, there will be 27.25 DraftKings FPTS available and then for fastest laps, there will be approximately 40.5 DraftKings FPTS, as I’m expecting around 90 green flag laps. That is around the average for the previous Charlotte ROVAL.
- There are essentially now two different classes of road course tracks: the “traditional” road courses (such as Watkins Glen and Sonoma) and then the rovals (such as here at Charlotte and at the Daytona Road Course). I would weigh the rovals slightly heavier in your data sets this week than the traditional courses.
- There’s a ton of chalk this weekend, which means it could be huge to make just minor pivots with your lineups on Sunday. We’re going to see some drivers have huge ownerships compared to similar options, with similar upside. If two drivers have similar upsides, don’t be afraid to be overweight on one and underweight on the chalk.
Dominators
These are the potential dominators for Sunday’s race at the Charlotte ROVAL, and are listed in the order of likelihood according to my projections:
- Chase Elliott
- Kyle Larson
- Denny Hamlin
- Martin Truex, Jr.
- Christopher Bell
- Joey Logano
- Ryan Blaney
Some “surprise” dominators that could happen on Sunday include Brad Keselowski, William Byron, Kyle Busch, and Alex Bowman.
Driver-by-Driver Breakdown Video
Now for the video breakdown! Be sure to go here and subscribe to my YouTube channel if you haven’t already.
Optimal Lineup According to Jordan’s Projections
The optimal DraftKings lineup for Charlotte ROVAL according to my Projections is:
- Chase Elliott
- Kyle Larson
- Matt DiBenedetto
- Tyler Reddick
- Chase Briscoe
- Cole Custer
Confidence Rating = 8.3/10. At first glance, I really like this lineup as a tournament play. It gets you off of the Allmendinger and Preece chalk, but you’re covered with the DiBenedetto and Reddick place differential upside. With Chase Briscoe, you have a driver that can legitimately challenge for a top 10 finish, with the biggest question mark being Cole Custer. More on him later.
Stacking Dennys Podcast with Jordan & RotoDoc
GPP / Tournament Picks
Joey Logano ($8,100) – My algorithm reaallyyy likes Joey Logano this weekend. In DraftKings, he’s an incredibly risky place considering he starts 3rd, but I think Logano is going to be so under-owned for his salary that it makes sense to be overweight on him. Joey finished 2nd here at the Charlotte ROVAL last season and has led 10+ laps in three of the five useful road course races this season. Logano can get into the optimal on Sunday if he finishes top 3 and leads a decent amount of laps. My only concern is that he doesn’t really pick up fastest laps, but at $8,100, he is worth being overweight on.
Chase Briscoe ($7,600) – Chase Briscoe isn’t going to “come out of left field” on Sunday, but considering he’s priced in the same area as the chalk DraftKings plays of Matt DiBenedetto ($7,900) and Tyler Reddick ($7,800), Briscoe is probably going to be under-owned compared to where he should be. Chase will start from back in 22nd on Sunday and has finished 9th or better in three of the five useful road course races this year. He has a win here at the Charlotte ROVAL in the Xfinity Series and was one of the best in all three starts in that series as well. I love Briscoe as a pivot, or even in addition to the chalk this weekend.
Cole Custer ($5,700) – My projections love Cole Custer for Sunday’s Bank of America ROVAL 400, and I agree. I especially like the fact that so many people are more likely to go with Ryan Preece ($6,000) or Corey LaJoie ($5,500) in this price range. However, as I explained in my video, it’s really not going to take a miracle for Custer to outscore those two in DraftKings points on Sunday. Custer finished 9th here at the Charlotte ROVAL last season and has top 20 finishes in four of the five useful road course races this year (including a 13th at the Daytona Road Course).
Cash Core Drivers
AJ Allmendinger ($11,200) – In tournaments, I like being underweight on AJ Allmendinger, but when it comes to cash lineups, he’s a no-brainer on Sunday. The Dinger will start from back in 33rd when the Bank of America ROVAL 400 goes green this weekend and he has legitimate top 5 finishing upside. My projections have Allmendinger at an average finish of 10.5, but judging by his talent and how he’s performed on them this season, that’s too low. And even with that lower projected finish, Allmendinger is still the highest projected driver on the slate.
Kyle Larson ($10,300) – To me, Kyle Larson and Chase Elliott ($10,700) are a coin flip this weekend. Larson starts two spots further back and comes at a $400 discount, though. Both have race-winning potential and both can dominate this race. Larson has slightly better upside but it’s not by much. Looking at the Playoff picture, Larson has a bit more of a cushion than Chase does, so he can afford to be more aggressive. On the road courses this season, Larson has two wins and four finishes of 3rd or better. He also led 52 laps in his two starts here at the Charlotte ROVAL while with Chip Ganassi Racing.
Tyler Reddick ($7,800) – What an under-price here. Reddick finished 12th here at the Charlotte ROVAL last season and has posted top 10 finishes in three of the six road course events in 2021. He’ll start from back in 29th on Sunday, too, which makes this. sub-$8,000 DraftKings salary make even less sense. Anyway, Reddick is a safe play with one of the highest ceilings in the field when it comes to DraftKings scoring. The #8 Chevrolet should be at least a top 15 car on Sunday with top 10 potential as well.
Bank of America ROVAL 400 at Charlotte DraftKings Driver Projections
The following chart takes into account the very basics: the starting position and the projected finish of each driver. The projected finishes are averaged from six different ranking systems. Also factored in are projected laps led and fastest laps for each driver. You can click the headers below to sort the chart by that attribute. By default it is sorted by average projected FPTS.
| Driver | DraftKings Salary | Avg Proj FPTS | Proj Ownership | Starting Position | Ceiling Proj FPTS | Avg. Projected Finish | Dollar Per FPT |
|---|---|---|---|---|---|---|---|
| AJ Allmendinger | $11,200 | 59.63 | 44.01% | 33 | 82.85 | 10.5 | $188 |
| Chase Elliott | $10,700 | 59.58 | 39.55% | 8 | 73.65 | 02.5 | $180 |
| Kyle Larson | $10,300 | 58.18 | 40.90% | 10 | 75.60 | 02.8 | $177 |
| Martin Truex Jr | $10,100 | 49.63 | 20.35% | 5 | 59.35 | 03.2 | $203 |
| Tyler Reddick | $7,800 | 43.73 | 34.84% | 29 | 57.90 | 15.5 | $178 |
| Ross Chastain | $9,300 | 41.47 | 19.19% | 27 | 54.80 | 15.8 | $224 |
| William Byron | $9,700 | 41.30 | 15.04% | 11 | 47.75 | 08.5 | $235 |
| Joey Logano | $8,100 | 40.47 | 9.91% | 3 | 49.75 | 05.7 | $200 |
| Kurt Busch | $8,700 | 40.07 | 19.27% | 13 | 46.90 | 09.3 | $217 |
| Christopher Bell | $8,400 | 38.43 | 10.63% | 4 | 54.35 | 07.7 | $219 |
| Kyle Busch | $9,900 | 37.72 | 14.71% | 9 | 49.00 | 09.0 | $262 |
| Chase Briscoe | $7,600 | 37.33 | 19.45% | 22 | 57.65 | 14.7 | $204 |
| Matt DiBenedetto | $7,900 | 36.62 | 29.18% | 30 | 43.45 | 18.5 | $216 |
| Denny Hamlin | $9,500 | 35.35 | 15.80% | 1 | 53.55 | 07.8 | $269 |
| Ryan Blaney | $9,100 | 35.33 | 16.05% | 6 | 52.80 | 09.5 | $258 |
| Alex Bowman | $8,900 | 35.17 | 18.09% | 12 | 46.75 | 10.7 | $253 |
| Kevin Harvick | $8,200 | 29.95 | 12.65% | 7 | 42.45 | 09.7 | $274 |
| Ryan Preece | $6,000 | 27.17 | 28.16% | 31 | 31.00 | 23.3 | $221 |
| Cole Custer | $5,700 | 26.67 | 15.18% | 23 | 51.00 | 19.3 | $214 |
| Brad Keselowski | $8,500 | 24.45 | 8.83% | 2 | 36.15 | 13.3 | $348 |
| Chris Buescher | $6,900 | 23.33 | 13.63% | 16 | 29.45 | 17.5 | $296 |
| Aric Almirola | $7,300 | 22.33 | 12.30% | 21 | 28.00 | 20.8 | $327 |
| Michael McDowell | $7,100 | 22.33 | 11.39% | 19 | 32.00 | 20.3 | $318 |
| Austin Dillon | $6,500 | 22.33 | 15.30% | 14 | 42.00 | 17.3 | $291 |
| Erik Jones | $6,400 | 21.83 | 16.77% | 17 | 32.00 | 19.3 | $293 |
| Joey Hand | $6,200 | 19.33 | 10.11% | 36 | 30.00 | 29.8 | $321 |
| Daniel Suarez | $7,000 | 16.83 | 16.64% | 25 | 23.00 | 25.7 | $416 |
| Ricky Stenhouse Jr | $5,600 | 15.50 | 11.86% | 18 | 25.00 | 22.7 | $361 |
| Justin Haley | $7,400 | 14.50 | 10.38% | 38 | 17.00 | 32.2 | $510 |
| Corey Lajoie | $5,500 | 13.00 | 14.33% | 26 | 24.00 | 27.8 | $423 |
| Scott Heckert | $5,900 | 11.83 | 2.33% | 35 | 17.00 | 32.7 | $499 |
| Ryan Newman | $6,700 | 11.17 | 12.67% | 24 | 16.00 | 27.8 | $600 |
| Cody Ware | $4,600 | 07.00 | 1.98% | 32 | 20.00 | 33.8 | $657 |
| Josh Bilicki | $5,000 | 06.83 | 2.23% | 37 | 14.00 | 36.2 | $732 |
| Timmy Hill | $4,900 | 05.83 | 1.41% | 39 | 14.00 | 37.5 | $840 |
| Garrett Smithley | $4,700 | 04.00 | 1.11% | 34 | 13.00 | 36.0 | $1,175 |
| Anthony Alfredo | $5,100 | 01.50 | 5.02% | 20 | 10.00 | 30.3 | $3,400 |
| Bubba Wallace | $5,300 | -00.67 | 8.25% | 15 | 09.00 | 28.8 | -$7,950 |
| Quin Houff | $4,500 | -02.83 | 0.50% | 28 | 05.00 | 36.2 | -$1,588 |


