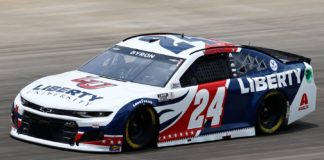
We’re going to line ’em up and run ’em again this weekend, as we have the Verizon 200 at The Brickyard this afternoon. Last weekend at Watkins Glen, we got another “normal” road course race with nothing too crazy happening, and if we get that same thing here at Indianapolis today, you can expect the exact same drivers to be in contention. As mentioned on the Stacking Dennys podcast this week, the only thing the Watkins Glen race has done is give us one more race of data to consider, but who’s actually fast hasn’t changed. There was one practice session this weekend (click here for speeds) but make sure you don’t over-value the speeds of one 55-minute practice on a brand new track. We don’t have much time between qualifying and the race so let’s goooo!!!!
Enjoy the FREE content that this site offers each week? Consider donating to support by clicking here. Also, be sure to check out the Algorithm Predicted Finishing Order for this race by clicking here!
Speed Report & Loop Data Driver Averages
Again, we’re focusing on road course tracks this weekend. So far in 2021, we have raced at the Daytona Road Course, COTA, Sonoma, Road America, and Watkins Glen (which was last week). Below you will find the Driver Averages and Statistics charts for those five races, as well as a second table that disregards COTA since it was ran in the rain. The following statistics are included in these tables:
- Starts
- Finish
- ARP = average running position
- DR = driver rating
- FL = fastest laps (total)
- LL = laps led (total)
- T15 = laps ran inside top 15 (total)
- Total Laps = laps completed (total)
2021 Driver Averages At Road Courses
| Kyle Larson | 5 | 10.0 | 05.9 | 117.6 | 54 | 88 | 346 | 368 |
| Chase Elliott | 5 | 05.4 | 08.1 | 121.7 | 69 | 86 | 301 | 368 |
| Martin Truex Jr | 5 | 12.4 | 08.6 | 104.7 | 26 | 38 | 287 | 338 |
| Denny Hamlin | 5 | 07.0 | 09.4 | 101.5 | 20 | 13 | 303 | 368 |
| Kyle Busch | 5 | 11.4 | 10.2 | 106.7 | 12 | 18 | 282 | 367 |
| Joey Logano | 5 | 09.2 | 10.5 | 99.7 | 8 | 40 | 287 | 368 |
| Kurt Busch | 5 | 10.8 | 11.3 | 92.4 | 3 | 12 | 263 | 368 |
| Christopher Bell | 5 | 14.4 | 12.5 | 91.6 | 25 | 5 | 246 | 332 |
| Ross Chastain | 5 | 13.8 | 12.9 | 89.9 | 5 | 4 | 249 | 324 |
| William Byron | 5 | 23.6 | 13.6 | 83.5 | 12 | 20 | 251 | 351 |
| Alex Bowman | 5 | 13.8 | 14.6 | 82.2 | 3 | 3 | 197 | 368 |
| Kevin Harvick | 5 | 20.0 | 14.6 | 73.4 | 3 | 0 | 200 | 333 |
| Tyler Reddick | 5 | 16.8 | 15.5 | 78.7 | 5 | 5 | 194 | 356 |
| Matt DiBenedetto | 5 | 20.8 | 16.4 | 74.7 | 5 | 10 | 190 | 363 |
| Chase Briscoe | 5 | 14.0 | 16.5 | 77.0 | 0 | 0 | 181 | 368 |
| Chris Buescher | 5 | 15.0 | 17.1 | 72.5 | 1 | 0 | 147 | 368 |
| Austin Dillon | 5 | 17.0 | 17.3 | 72.3 | 0 | 0 | 179 | 367 |
| Ryan Blaney | 5 | 15.2 | 18.1 | 72.6 | 1 | 0 | 145 | 368 |
| Michael McDowell | 5 | 18.8 | 18.6 | 72.1 | 3 | 3 | 125 | 368 |
| Brad Keselowski | 5 | 17.4 | 18.7 | 69.7 | 0 | 9 | 147 | 365 |
| Aric Almirola | 5 | 20.0 | 18.8 | 63.5 | 0 | 1 | 123 | 368 |
| Cole Custer | 5 | 20.8 | 18.9 | 63.7 | 0 | 0 | 118 | 338 |
| Erik Jones | 5 | 17.4 | 19.8 | 65.8 | 1 | 0 | 106 | 367 |
| Ryan Preece | 4 | 18.3 | 21.1 | 65.8 | 3 | 2 | 73 | 305 |
| Ricky Stenhouse Jr | 5 | 21.6 | 22.5 | 58.1 | 2 | 1 | 60 | 316 |
| Corey LaJoie | 5 | 22.8 | 22.8 | 53.0 | 0 | 0 | 73 | 368 |
| Ryan Newman | 5 | 26.8 | 23.5 | 47.7 | 0 | 0 | 51 | 367 |
| Bubba Wallace | 5 | 25.2 | 25.1 | 55.6 | 0 | 0 | 77 | 332 |
| Daniel Suarez | 5 | 25.6 | 25.6 | 56.7 | 5 | 2 | 69 | 349 |
| Anthony Alfredo | 5 | 26.8 | 26.4 | 45.9 | 0 | 0 | 35 | 347 |
| Justin Haley | 4 | 29.5 | 27.7 | 40.7 | 0 | 0 | 20 | 233 |
| James Davison | 5 | 28.4 | 29.9 | 41.3 | 0 | 0 | 10 | 319 |
| Cody Ware | 4 | 30.5 | 30.0 | 39.8 | 0 | 0 | 9 | 269 |
| Josh Bilicki | 5 | 30.2 | 30.1 | 38.8 | 0 | 0 | 7 | 364 |
| Garrett Smithley | 4 | 30.8 | 32.4 | 31.8 | 0 | 0 | 0 | 303 |
| Quin Houff | 5 | 35.2 | 33.2 | 27.6 | 0 | 0 | 0 | 260 |
| AJ Allmendinger | 3 | 13.7 | 16.1 | 84.6 | 7 | 2 | 87 | 186 |
| Austin Cindric | 2 | 31.5 | 16.8 | 80.6 | 1 | 6 | 56 | 89 |
2021 Driver Averages At Road Courses (Minus COTA)
| Denny Hamlin | 4 | 05.3 | 08.5 | 108.3 | 20 | 13 | 273 | 314 |
| Chase Elliott | 4 | 06.5 | 08.1 | 121.9 | 57 | 81 | 256 | 314 |
| Kurt Busch | 4 | 06.8 | 11.2 | 96.4 | 3 | 12 | 227 | 314 |
| Martin Truex Jr | 4 | 06.8 | 07.3 | 112.3 | 26 | 35 | 274 | 314 |
| Christopher Bell | 4 | 08.5 | 11.5 | 101.6 | 24 | 5 | 233 | 314 |
| Joey Logano | 4 | 10.8 | 11.2 | 93.5 | 6 | 26 | 238 | 314 |
| Kyle Busch | 4 | 11.8 | 10.8 | 104.7 | 3 | 6 | 237 | 313 |
| Kyle Larson | 4 | 12.0 | 05.7 | 116.3 | 51 | 84 | 297 | 314 |
| Ryan Blaney | 4 | 14.8 | 17.3 | 75.0 | 1 | 0 | 131 | 314 |
| Alex Bowman | 4 | 15.3 | 14.6 | 80.9 | 3 | 0 | 164 | 314 |
| Chris Buescher | 4 | 15.5 | 17.3 | 71.5 | 1 | 0 | 114 | 314 |
| Kevin Harvick | 4 | 15.8 | 13.5 | 83.7 | 3 | 0 | 200 | 314 |
| Chase Briscoe | 4 | 16.0 | 17.2 | 73.0 | 0 | 0 | 138 | 314 |
| Ross Chastain | 4 | 16.3 | 13.5 | 84.9 | 2 | 0 | 206 | 270 |
| Brad Keselowski | 4 | 17.0 | 18.1 | 72.9 | 0 | 9 | 135 | 311 |
| Cole Custer | 4 | 17.0 | 18.0 | 69.2 | 0 | 0 | 117 | 314 |
| Erik Jones | 4 | 17.8 | 19.7 | 65.8 | 1 | 0 | 94 | 313 |
| AJ Allmendinger | 2 | 18.0 | 17.1 | 80.6 | 6 | 2 | 54 | 132 |
| Austin Dillon | 4 | 18.3 | 17.0 | 73.3 | 0 | 0 | 158 | 313 |
| Aric Almirola | 4 | 18.5 | 18.2 | 66.7 | 0 | 1 | 116 | 314 |
| Tyler Reddick | 4 | 18.8 | 15.7 | 79.4 | 5 | 5 | 166 | 302 |
| Ryan Preece | 3 | 19.3 | 23.1 | 61.3 | 3 | 0 | 36 | 251 |
| Matt DiBenedetto | 4 | 20.3 | 16.3 | 76.4 | 5 | 10 | 167 | 309 |
| Ricky Stenhouse Jr | 4 | 21.5 | 22.7 | 57.2 | 1 | 1 | 40 | 262 |
| Bubba Wallace | 4 | 21.8 | 24.8 | 52.5 | 0 | 0 | 66 | 314 |
| Michael McDowell | 4 | 21.8 | 19.9 | 63.1 | 1 | 0 | 89 | 314 |
| Corey LaJoie | 4 | 23.5 | 23.5 | 50.5 | 0 | 0 | 52 | 314 |
| Daniel Suarez | 4 | 23.8 | 24.2 | 58.6 | 5 | 2 | 69 | 303 |
| Justin Haley | 3 | 26.0 | 27.2 | 42.9 | 0 | 0 | 17 | 221 |
| William Byron | 4 | 26.8 | 12.7 | 83.7 | 12 | 20 | 225 | 297 |
| Ryan Newman | 4 | 27.5 | 23.7 | 47.9 | 0 | 0 | 39 | 313 |
| James Davison | 4 | 28.3 | 29.4 | 40.3 | 0 | 0 | 9 | 265 |
| Anthony Alfredo | 4 | 29.0 | 27.3 | 42.7 | 0 | 0 | 28 | 293 |
| Cody Ware | 3 | 30.0 | 30.6 | 35.6 | 0 | 0 | 5 | 216 |
| Josh Bilicki | 4 | 30.3 | 30.2 | 36.1 | 0 | 0 | 6 | 310 |
| Garrett Smithley | 3 | 31.7 | 33.3 | 29.9 | 0 | 0 | 0 | 249 |
| Quin Houff | 4 | 35.5 | 33.2 | 26.9 | 0 | 0 | 0 | 222 |
| Austin Cindric | 1 | 38.0 | 26.7 | 86.5 | 1 | 2 | 19 | 35 |
DraftKings Strategy & Dominators for Brickyard Road Course
This weekend’s race at Indianapolis is on the road course, which means we’re focusing mainly on place differential and finishing position for this race. Yes, there are going to be some dominator points, but with only 82 laps, it’s well below the usual.
- Make sure you look back at the other “traditional” road courses when analyzing data for today’s race. I’d mainly focus on Watkins Glen data, this year’s Road America data, and maybe Sonoma. The next tier of data to look at would be at the rovals, but I would slightly devalue it compared to “traditional” road course data (although it’s still a strong data set to use). You can go ahead and throw this year’s COTA data in the trash.
- Again, there are only 82 laps scheduled for today’s Verizon 200 at The Brickyard, so there aren’t going to be too many dominator points. We should focus mainly on finishing position and place differential. For laps led, there will be 20.5 DraftKings FPTS available and then for fastest laps, there will be approximately 29.25 DraftKings FPTS, as I’m expecting around 65 green flag laps.
- Yes, there was practice this weekend, and yes we can pull some data from it. But keep in mind that it was one 55-minute session on a brand new track. Drivers are going to learn a lot more during the first half of this race today, and the best road course racers will finish up front if nothing crazy happens.
Dominators
These are the potential dominators for Sunday’s race at Indianapolis, and are listed in the order of likelihood according to my projections:
- Chase Elliott
- Kyle Larson
- Martin Truex, Jr.
- William Byron
- Christopher Bell
Some “surprise” dominators that could happen on Sunday include: Chase Briscoe, Austin Cindric, Denny Hamlin, and Joey Logano.
Optimal Lineup According to Jordan’s Projections
The optimal DraftKings lineup for Indy Road Course according to my Projections is:
- Kyle Busch
- Denny Hamlin
- Christopher Bell
- Brad Keselowski
- Austin Dillon
- Ryan Preece
Confidence Rating = 7.3/10. This is a very safe cash lineup to use. You’re really just going all place differential here, but it works out because all three Joe Gibbs Racing cars have top 5 potential, while Brad Keselowski only needs a halfway decent finish to hit value today. The top lineup with Chase Elliott in it, according to my projections, is: Elliott, Bell, Kurt Busch, Keselowski, Austin Dillon, and Preece.
GPP / Tournament Picks
Martin Truex, Jr. ($10,400) – Both Chase Elliott ($11,000) and Kyle Larson ($10,800) are the obvious favorites to win today’s race at the Indianapolis Road Course, and rank 1st and 3rd in my projected DraftKings points today, but don’t count out Martin Truex, Jr. The reason? His paint scheme. Just kidding, but seriously. If you’ve followed me for very long you know that I’v e proven that Truex wins and dominates more than usual when he runs the Auto Owners paint scheme, and he has a little more place differential potential than Elliott and Larson today. If the #19 Toyota can get out front early today, we could easily see Truex lead the most laps for the second road course race in a row.
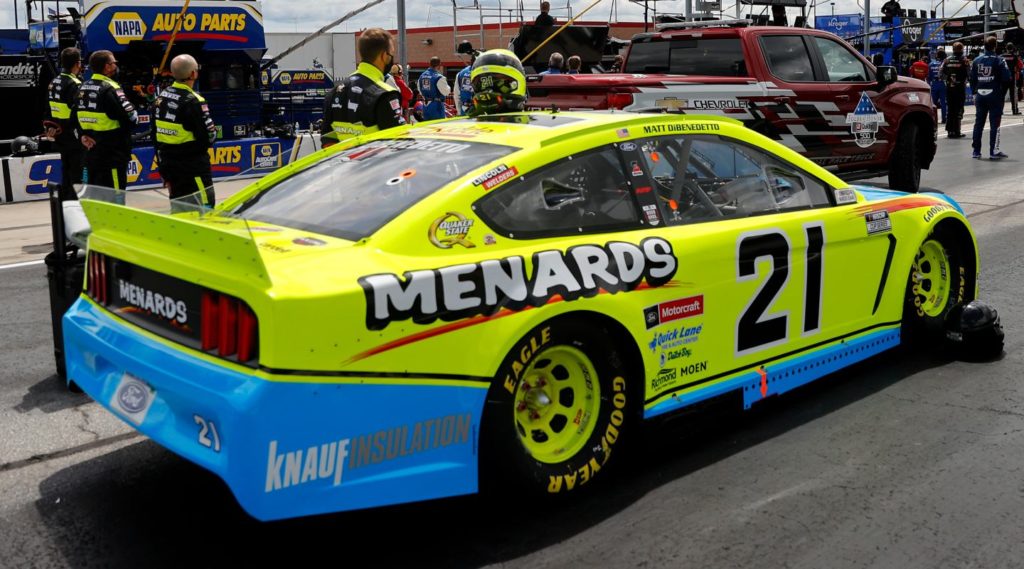
Matt DiBenedetto ($7,400) – If you want to get off of that Brad Keselowski ($8,200) / Kevin Harvick ($8,000) chalk in the mid-range of this slate, consider Matt DiBenedetto down at $7,400 this weekend. Matty D has shown potential in the past at road course races and recently he came home 11th at Watkins Glen and 10th at Road America. He starts 15th here in today’s Verizon 200 at The Brickyard but has top 10 finishing potential. I just hope this team has dialed the setup back a little bit and the car has more long run speed than we saw at Road America.
Austin Dillon ($6,300) – I think down in this price range Ricky Stenhouse, Jr. ($5,900) is going to end up being the chalkier pick over Austin Dillon due to the $400 discount in salary, so give me AD as a tournament play today. In addition to running the Xfinity race on Saturday (extra track time), the #3 Chevrolet has simply been better than the #47 Chevrolet on road courses this year; Dillon has an average running position of 17.3 on road courses in 2021 while Stenhouse is at 22.5, and when it comes to average finish, Austin is at 17.0 while Ricky is at 21.6.
Cash Core Drivers
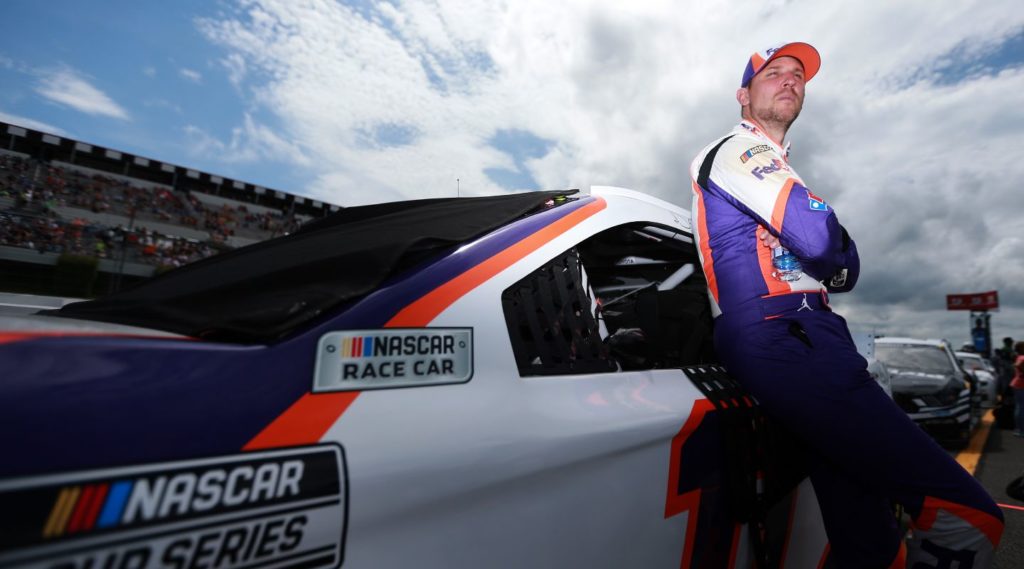
Denny Hamlin ($10,000) – In qualifying on Sunday, Hamlin admittedly just messed up his lap to get into the final round of qualifying, but was more than confident that he would be able to challenge for the win. I personally don’t see that happening, but you never know, and a simple top 5 finish will be more than enough to pay off in DraftKings. Statistically, Hamlin has the 4th-best average running position on road courses this year and the 2nd-best average finish, and if you take out COTA, his average finish (5.3) is actually the best in the series.
Christopher Bell ($9,200) – According to my projections, Christopher Bell offers the best value-per-dollar on the slate today, as he’s starting back in 17th but has legitimate top 5 finishing potential. The projections have him with an average assumed finish of 7.2 today, and even then CBell is showing as a great value play in DraftKings. Getting a potential race-winning driver for $9,200 that also has solid place differential potential is a slam dunk in DFS. Roll with Christopher Bell today at the Indianapolis Road Course.
Ryan Preece ($5,700) – Yeah, I don’t like it very much but I think this is how the best lineup builds are going to go today. Ryan Preece has the most potential of the sub-$6,000 DraftKings drivers today, as he’s starting back in 30th but should finish in the mid to upper 20s if nothing goes wrong. This #37 team had a loose wheel plague them at Watkins Glen last weekend and ended up finishing 28th, but before that, Preece finished 23rd or better in six of the last seven road course races. He has an average running position of 21.1 on them this season.
Verizon 200 at The Brickyard DraftKings Driver Projections
The following chart takes into account the very basics: the starting position and the projected finish of each driver. The projected finishes are averaged from six different ranking systems. Also factored in are projected laps led and fastest laps for each driver. You can click the headers below to sort the chart by that attribute. By default it is sorted by average projected FPTS.
| Driver | DraftKings Salary | Avg Proj FPTS | Starting Position | Ceiling Proj FPTS | Avg. Projected Finish | Dollar Per FPT |
|---|---|---|---|---|---|---|
| Chase Elliott | $11,000 | 58.97 | 3 | 67.80 | 02.0 | $187 |
| Kyle Busch | $10,200 | 54.10 | 21 | 59.75 | 06.0 | $189 |
| Kyle Larson | $10,800 | 53.43 | 4 | 62.50 | 02.8 | $202 |
| Denny Hamlin | $10,000 | 51.52 | 14 | 61.70 | 04.0 | $194 |
| Christopher Bell | $9,200 | 50.53 | 17 | 60.70 | 07.2 | $182 |
| Martin Truex Jr | $10,400 | 48.28 | 6 | 59.45 | 03.3 | $215 |
| Kurt Busch | $9,000 | 44.00 | 20 | 58.90 | 09.8 | $205 |
| Brad Keselowski | $8,200 | 40.00 | 31 | 50.00 | 16.8 | $205 |
| Austin Cindric | $9,400 | 39.77 | 13 | 56.05 | 09.8 | $236 |
| Alex Bowman | $8,400 | 39.67 | 24 | 45.45 | 13.0 | $212 |
| Joey Logano | $9,600 | 38.98 | 7 | 48.05 | 06.8 | $246 |
| Kevin Harvick | $8,000 | 36.95 | 25 | 49.90 | 15.0 | $217 |
| William Byron | $9,800 | 34.68 | 1 | 54.55 | 07.7 | $283 |
| Ryan Blaney | $8,600 | 32.50 | 16 | 42.45 | 13.5 | $265 |
| AJ Allmendinger | $8,800 | 31.93 | 8 | 39.20 | 10.7 | $276 |
| Austin Dillon | $6,300 | 30.83 | 23 | 36.00 | 17.5 | $204 |
| Ross Chastain | $7,700 | 28.83 | 9 | 41.90 | 12.5 | $267 |
| Tyler Reddick | $7,600 | 28.40 | 11 | 38.80 | 13.7 | $268 |
| Erik Jones | $6,700 | 27.17 | 28 | 33.00 | 22.3 | $247 |
| Chris Buescher | $7,100 | 26.00 | 19 | 34.00 | 18.0 | $273 |
| Ryan Preece | $5,700 | 24.67 | 30 | 33.00 | 23.7 | $231 |
| Matt DiBenedetto | $7,400 | 23.40 | 15 | 38.25 | 18.3 | $316 |
| Chase Briscoe | $7,900 | 21.20 | 2 | 40.65 | 14.2 | $373 |
| Ricky Stenhouse Jr | $5,900 | 21.17 | 22 | 33.00 | 21.7 | $279 |
| Aric Almirola | $6,900 | 19.00 | 18 | 29.00 | 21.2 | $363 |
| Ryan Newman | $6,100 | 18.33 | 32 | 26.00 | 28.2 | $333 |
| Corey Lajoie | $5,600 | 16.33 | 26 | 31.00 | 26.7 | $343 |
| Bubba Wallace | $6,000 | 14.67 | 27 | 27.00 | 27.7 | $409 |
| Anthony Alfredo | $5,300 | 13.17 | 33 | 19.00 | 30.7 | $403 |
| Michael McDowell | $7,200 | 13.00 | 12 | 27.45 | 21.2 | $554 |
| James Davison | $5,200 | 11.67 | 34 | 16.00 | 32.0 | $446 |
| Cody Ware | $4,700 | 09.83 | 37 | 16.00 | 34.2 | $478 |
| Justin Haley | $5,500 | 09.67 | 29 | 21.00 | 30.8 | $569 |
| Cole Custer | $6,400 | 09.33 | 10 | 23.00 | 21.7 | $686 |
| Garrett Smithley | $4,600 | 07.67 | 39 | 16.00 | 35.8 | $600 |
| Josh Bilicki | $5,000 | 06.00 | 36 | 11.00 | 35.5 | $833 |
| Quin Houff | $4,500 | 04.17 | 38 | 13.00 | 37.0 | $1,080 |
| Timmy Hill | $4,800 | 03.67 | 40 | 05.00 | 38.8 | $1,309 |
| Daniel Suarez | $6,600 | 02.62 | 5 | 29.90 | 23.8 | $2,522 |


