The NASCAR Cup Series closes out the first third of the 2021 season this weekend, as race #12 at Darlington Raceway is this Sunday with the Goodyear 400. Typically we run these Darlington races at night, but this one will be during the heat of the day, and the track should be hot and slick during the race. Tire fall-off is going to be huge here so it’s going to be very difficult for teams to gamble, which means we should see the best cars and drivers up front for most of the race. Brad Keselowski is on the pole again this weekend and you can see the full starting lineup by clicking here. Now let’s goooo!!!!
Enjoy the FREE content that this site offers each week? Consider donating to support by clicking here. Also, be sure to check out the Algorithm Predicted Finishing Order for this race by clicking here!
Darlington Speed Report & Loop Data Driver Averages
We go from a “low-wear” track at Kansas last weekend to a “high-wear” track with Darlington this weekend. However, when looking at stats for Darlington, there’s a couple of curveballs that we have to deal with this for this race. First, Darlington really isn’t like any other track on the circuit. It’s 1.366 miles in length and egg shaped. It doesn’t compare really well to anything, so I typically focus a lot on previous Darlington races.
Also, NASCAR decided to go with the 750 hp package for this race, which is usually for tracks one mile or less in length and the road courses. Will that be as big of a deal as everyone is making it? We’ll find out soon enough, but I’m not trying to over-think this race. I’ve included two charts below with data: 2019 and 2020 Darlington races, and then 2016 through 2018 Darlington races. The reason I separated the 2016 through 2018 Darlington races is because that was the low downforce era, which compares decently well to this 750 hp package.
Also, if you’re looking to check out the “high-wear” loop data from 2021, you can click here for Green Flag Speed from Homestead, and click here for the full Loop Data Box Score from Homestead. Also, you can click here for Green Flag Speed from Atlanta, and click here for the full Loop Data Box Score from Atlanta.
The following statistics are included in the charts below. You can click on column headers to sort by that column.
- Starts
- Finish
- ARP = average running position
- DR = driver rating
- FL = fastest laps (total)
- LL = laps led (total)
- T15 = laps ran inside top 15 (total)
- Total Laps = laps completed (total)
2019-2020 Driver Averages at Darlington
| Kyle Larson | 1 | 02.0 | 04.3 | 160.92 | 127.2 | 40 | 44 | 361 | 367 |
| Kevin Harvick | 4 | 02.3 | 07.0 | 159.52 | 118.7 | 105 | 201 | 1149 | 1235 |
| Erik Jones | 4 | 04.5 | 08.8 | 159.20 | 105.8 | 39 | 106 | 1120 | 1235 |
| Kurt Busch | 4 | 08.3 | 09.4 | 159.07 | 97.1 | 97 | 99 | 981 | 1235 |
| Brad Keselowski | 4 | 08.3 | 10.1 | 158.71 | 99.3 | 48 | 106 | 995 | 1235 |
| Kyle Busch | 4 | 09.5 | 10.5 | 158.91 | 97.1 | 67 | 118 | 892 | 1234 |
| Joey Logano | 4 | 10.3 | 12.4 | 158.74 | 91.3 | 25 | 19 | 900 | 1234 |
| Austin Dillon | 4 | 10.8 | 16.0 | 158.18 | 77.4 | 7 | 0 | 550 | 1235 |
| Alex Bowman | 4 | 11.0 | 08.3 | 159.30 | 102.2 | 85 | 42 | 1076 | 1233 |
| Aric Almirola | 4 | 11.3 | 14.8 | 158.28 | 83.2 | 2 | 0 | 679 | 1234 |
| Denny Hamlin | 4 | 12.0 | 08.0 | 158.42 | 99.7 | 54 | 31 | 1073 | 1224 |
| Matt DiBenedetto | 4 | 13.0 | 16.1 | 157.71 | 74.9 | 4 | 0 | 597 | 1234 |
| Martin Truex Jr | 4 | 13.3 | 10.1 | 159.45 | 104.7 | 139 | 212 | 905 | 1233 |
| Clint Bowyer | 4 | 13.8 | 09.0 | 159.01 | 98.2 | 57 | 72 | 1146 | 1235 |
| Tyler Reddick | 3 | 14.3 | 16.7 | 157.75 | 76.8 | 20 | 0 | 408 | 867 |
| Ryan Newman | 4 | 16.8 | 18.3 | 157.81 | 72.3 | 13 | 5 | 347 | 1233 |
| William Byron | 4 | 18.3 | 13.9 | 158.12 | 85.9 | 20 | 3 | 818 | 1219 |
| Ryan Blaney | 4 | 18.5 | 17.9 | 157.76 | 75.6 | 14 | 0 | 424 | 1233 |
| Chase Elliott | 4 | 20.3 | 08.9 | 158.98 | 98.0 | 85 | 151 | 1055 | 1225 |
| Cole Custer | 3 | 21.7 | 19.9 | 156.85 | 66.1 | 3 | 0 | 208 | 866 |
| Daniel Suarez | 4 | 22.0 | 23.3 | 156.30 | 54.5 | 0 | 1 | 303 | 1230 |
| Christopher Bell | 3 | 23.0 | 22.0 | 156.97 | 60.3 | 3 | 0 | 114 | 850 |
| Chris Buescher | 4 | 23.3 | 20.8 | 157.40 | 61.2 | 14 | 0 | 370 | 1226 |
| Michael McDowell | 4 | 23.5 | 24.5 | 157.03 | 54.3 | 0 | 0 | 34 | 1142 |
| Ryan Preece | 4 | 24.5 | 21.9 | 157.17 | 61.8 | 1 | 0 | 181 | 1094 |
| Bubba Wallace | 4 | 24.8 | 23.4 | 157.34 | 56.8 | 15 | 3 | 90 | 1083 |
| Ricky Stenhouse Jr | 3 | 25.7 | 24.2 | 157.61 | 58.3 | 13 | 0 | 111 | 925 |
| Ross Chastain | 2 | 28.5 | 31.2 | 153.60 | 38.6 | 1 | 0 | 5 | 721 |
| Quin Houff | 3 | 31.0 | 33.8 | 152.06 | 33.8 | 0 | 0 | 0 | 701 |
| Corey LaJoie | 4 | 32.0 | 30.0 | 156.20 | 43.6 | 1 | 0 | 13 | 1060 |
| Josh Bilicki | 2 | 33.0 | 33.9 | 150.25 | 32.3 | 2 | 0 | 0 | 642 |
| Garrett Smithley | 3 | 35.3 | 36.4 | 150.51 | 28.7 | 5 | 0 | 1 | 675 |
| BJ McLeod | 3 | 38.0 | 37.0 | 152.77 | 27.6 | 0 | 0 | 1 | 409 |
| James Davison | 1 | 39.0 | 37.6 | 150.60 | 25.3 | 0 | 0 | 0 | 162 |
2016-2018 Driver Averages At Darlington
| Kevin Harvick | 3 | 05.0 | 04.7 | 159.79 | 119.2 | 82 | 236 | 1082 | 1100 |
| Denny Hamlin | 3 | 05.0 | 06.2 | 159.64 | 112.8 | 74 | 148 | 1095 | 1101 |
| Erik Jones | 2 | 06.5 | 08.2 | 158.71 | 105.7 | 48 | 0 | 712 | 734 |
| Kyle Larson | 3 | 06.7 | 04.8 | 159.88 | 119.7 | 154 | 453 | 1071 | 1100 |
| Martin Truex Jr | 3 | 06.7 | 05.8 | 160.15 | 121.7 | 109 | 134 | 976 | 1101 |
| Kyle Busch | 3 | 06.7 | 07.2 | 159.60 | 101.7 | 32 | 7 | 1091 | 1101 |
| Brad Keselowski | 3 | 08.3 | 06.9 | 159.98 | 111.7 | 70 | 74 | 973 | 1100 |
| Joey Logano | 3 | 08.3 | 07.3 | 159.78 | 103.8 | 30 | 18 | 1075 | 1100 |
| Chase Elliott | 3 | 08.7 | 09.3 | 159.44 | 94.8 | 37 | 0 | 950 | 1100 |
| Austin Dillon | 3 | 10.7 | 14.2 | 158.63 | 82.4 | 11 | 0 | 699 | 1101 |
| Ryan Newman | 3 | 11.3 | 13.0 | 158.73 | 83.8 | 10 | 9 | 780 | 1100 |
| Jamie McMurray | 3 | 11.3 | 12.2 | 158.88 | 84.5 | 6 | 0 | 875 | 1100 |
| Matt Kenseth | 3 | 12.3 | 13.0 | 158.97 | 89.4 | 22 | 10 | 707 | 1098 |
| Jeff Gordon | 1 | 14.0 | 18.8 | 160.75 | 73.6 | 5 | 0 | 108 | 367 |
| Kurt Busch | 3 | 14.3 | 09.2 | 159.26 | 93.0 | 31 | 7 | 1025 | 1060 |
| Chris Buescher | 3 | 15.7 | 17.6 | 158.08 | 70.5 | 5 | 0 | 371 | 1100 |
| Paul Menard | 3 | 16.3 | 18.8 | 158.41 | 71.1 | 5 | 0 | 157 | 1099 |
| Ty Dillon | 2 | 17.0 | 20.4 | 156.83 | 67.4 | 3 | 0 | 128 | 731 |
| Kasey Kahne | 3 | 18.3 | 19.6 | 157.72 | 67.7 | 9 | 0 | 309 | 1095 |
| Carl Edwards | 1 | 19.0 | 11.3 | 161.68 | 82.4 | 2 | 0 | 309 | 366 |
| Ryan Blaney | 3 | 19.7 | 22.2 | 158.58 | 66.8 | 17 | 0 | 111 | 1090 |
| Ricky Stenhouse Jr | 3 | 19.7 | 21.2 | 157.44 | 64.9 | 4 | 0 | 215 | 1092 |
| Regan Smith | 1 | 20.0 | 26.5 | 158.89 | 51.1 | 4 | 0 | 2 | 366 |
| David Ragan | 3 | 21.3 | 25.1 | 156.61 | 52.4 | 19 | 0 | 2 | 1095 |
| Aric Almirola | 3 | 22.0 | 19.7 | 157.68 | 65.0 | 6 | 0 | 175 | 1078 |
| Dale Earnhardt Jr | 1 | 22.0 | 16.4 | 157.72 | 72.1 | 2 | 0 | 139 | 365 |
| Michael McDowell | 3 | 22.0 | 25.3 | 156.84 | 54.0 | 2 | 0 | 11 | 1094 |
| Alex Bowman | 1 | 23.0 | 24.6 | 156.00 | 66.9 | 38 | 0 | 35 | 365 |
| Danica Patrick | 2 | 25.0 | 27.1 | 158.04 | 53.8 | 13 | 0 | 0 | 728 |
| Casey Mears | 1 | 25.0 | 27.8 | 159.27 | 51.3 | 8 | 0 | 0 | 365 |
| Bubba Wallace | 1 | 26.0 | 28.6 | 155.44 | 49.3 | 2 | 0 | 0 | 363 |
| AJ Allmendinger | 3 | 26.3 | 27.7 | 156.25 | 49.5 | 4 | 0 | 2 | 1070 |
| Landon Cassill | 3 | 27.0 | 30.0 | 155.29 | 44.5 | 0 | 5 | 25 | 1083 |
| Corey Lajoie | 2 | 27.5 | 29.3 | 154.61 | 45.5 | 3 | 0 | 1 | 720 |
| Jimmie Johnson | 3 | 28.0 | 21.4 | 158.98 | 72.7 | 21 | 0 | 408 | 921 |
| Ross Chastain | 1 | 28.0 | 31.5 | 153.63 | 41.6 | 1 | 0 | 0 | 360 |
| Michael Annett | 1 | 28.0 | 33.0 | 156.94 | 36.2 | 0 | 0 | 0 | 362 |
| Josh Wise | 1 | 29.0 | 34.5 | 156.39 | 33.2 | 1 | 0 | 0 | 361 |
| Cole Whitt | 2 | 30.0 | 30.3 | 155.30 | 39.2 | 0 | 0 | 2 | 614 |
| Matt DiBenedetto | 3 | 30.3 | 29.5 | 155.79 | 44.1 | 3 | 0 | 0 | 980 |
| JJ Yeley | 1 | 31.0 | 34.4 | 149.66 | 34.2 | 0 | 0 | 0 | 350 |
| BJ McLeod | 1 | 32.0 | 36.2 | 148.08 | 30.1 | 0 | 0 | 0 | 347 |
| Derrike Cope | 2 | 32.5 | 34.8 | 150.37 | 31.4 | 0 | 0 | 2 | 697 |
| Clint Bowyer | 3 | 32.7 | 22.4 | 158.53 | 50.8 | 39 | 0 | 298 | 692 |
| Carl Long | 1 | 33.0 | 33.8 | 150.23 | 34.3 | 2 | 0 | 1 | 350 |
| Daniel Suarez | 2 | 33.5 | 27.5 | 155.89 | 53.3 | 4 | 0 | 33 | 483 |
| Jeffrey Earnhardt | 3 | 34.0 | 33.8 | 153.07 | 33.6 | 5 | 0 | 0 | 947 |
| William Byron | 1 | 35.0 | 12.6 | 155.86 | 67.8 | 2 | 0 | 328 | 329 |
| Tony Stewart | 1 | 35.0 | 16.4 | 161.06 | 65.6 | 0 | 0 | 218 | 317 |
| Reed Sorenson | 2 | 35.0 | 36.5 | 155.31 | 32.2 | 0 | 0 | 1 | 462 |
| Gray Gaulding | 1 | 36.0 | 33.7 | 154.15 | 39.4 | 10 | 0 | 0 | 202 |
| Greg Biffle | 1 | 36.0 | 23.9 | 159.36 | 53.4 | 3 | 0 | 13 | 295 |
| Cody Ware | 1 | 37.0 | 36.4 | 149.91 | 27.0 | 2 | 0 | 0 | 144 |
| Timmy Hill | 1 | 37.0 | 37.3 | 148.86 | 26.2 | 0 | 0 | 0 | 268 |
| Trevor Bayne | 2 | 37.5 | 35.3 | 155.35 | 34.9 | 3 | 0 | 0 | 497 |
| Brian Scott | 1 | 39.0 | 32.9 | 158.21 | 41.2 | 0 | 0 | 0 | 199 |
| Joey Gase | 1 | 40.0 | 38.4 | 148.99 | 26.3 | 0 | 0 | 0 | 120 |
DraftKings Strategy & Dominators for Darlington
Just like last week at Kansas, optimal lineup construction on Sunday at Darlington is going to come down to which drivers dominate and for how long. Typically we see two dominators at this track, but it wouldn’t be crazy to see one main dominator and then several other “mini dominators,” just like we had at Kansas last week. With just one main dominator, the rest of your DraftKings lineup then comes down to place differential/finish.
- There are 293 laps scheduled for Sunday’s Goodyear 400 at Darlington, which means there are 73.25 DraftKings FPTS up for grabs for those laps led. Additionally, you can expect right around 235 green flag laps, giving us an additional 105.75 (approximately) DraftKings FPTS up for grabs for fastest laps.
- Kansas is typically a 2 main dominator race, but we could see a couple of other “mini” dominators thrown into the mix as well. If my projections are correct, it’s going to come down to how quickly Kyle Larson gets to the front and how long he stays there.
- Goodyear is bringing the same tire combination that was used here at Darlington in the three races last year, and it was also used at Homestead earlier this season. Here’s what is being used:
Dominators
These are the potential dominators for Sunday’s race at Darlington, and are listed in the order of likelihood according to my projections:
- Kyle Larson
- Brad Keselowski
- Denny Hamlin
- Martin Truex, Jr.
- Kevin Harvick
- Kyle Busch
- William Byron
- Alex Bowman
- Chase Elliott
Some “surprise” dominators that could happen on Sunday include: Tyler Reddick, Joey Logano, and Kurt Busch.
Driver-by-Driver Breakdown Video
Now for the video breakdown! Be sure to go here and subscribe to my YouTube channel if you haven’t already.
Optimal Lineup According to Jordan’s Projections
The optimal DraftKings lineup for Darlington according to my Projections is:
- Kyle Larson
- Alex Bowman
- Kurt Busch
- Tyler Reddick
- Ryan Newman
- Ryan Preece
Confidence Rating = 7.6/10. I think this is a strong cash game lineup with no driver starting better than 10th. All six of these drivers could easily move up 5+ positions in Sunday’s race, but with no second dominator on there, you’re really relying on Kyle Larson to do what he did at Atlanta and Kansas. Is it possible? Yes. Is it probable? Yes, but not guaranteed. One of the other lineups that is solid according to my projections is that same one with Harvick instead of Alex Bowman, which I like, as well as: Kyle Larson, Denny Hamlin, Kurt Busch, Tyler Reddick, Ross Chastain, and Ryan Preece. Alternatively, you could also go with Alex Bowman and Harvick/Elliott instead of Hamlin and Kurt Busch with that line.
GPP / Tournament Picks
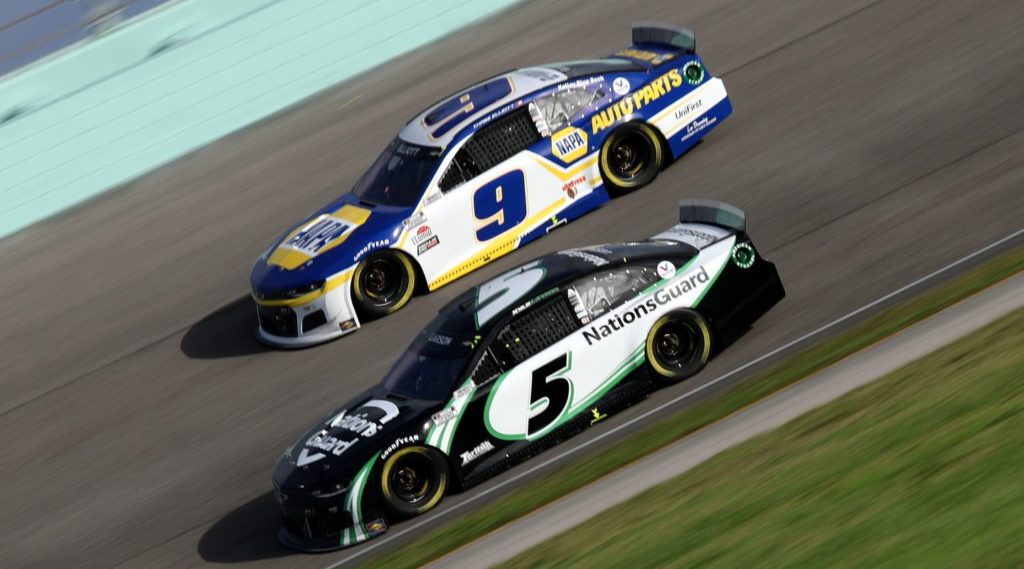
Chase Elliott ($9,200) – As mentioned in the breakdown video, I’m very curious to see where Chase Elliott ends up with ownership this weekend. With Alex Bowman ($9,400) right there, you have to think many DraftKings players are going to gravitate toward that place differential, and if that’s the case, I like pivoting to Chase (or combining the two). Elliott’s career average finish of 18.5 is going to scare some people off on Sunday but don’t forget that with a lucky break or two, Chase could have won two of the three Darlington races last season. Obviously this #9 Chevrolet isn’t performing to the level that we have come to expect thus far in 2021, but the defending Champion is going to return to form soon…
Daniel Suarez ($6,700) – It is slim pickings in this price range, and because of that, people are going to gravitate toward Tyler Reddick ($7,400) and Ryan Newman ($7,200), so I’m looking for ways to pivot off of that chalk. I mentioned in the video breakdown that I also like Bubba Wallace ($7,000) as a pivot here, but I don’t mind Daniel Suarez either. His track record here at Darlington is abysmal, but this car seems to just out-perform each and every week. Also, don’t forget that Suarez had a top 10 run going at Atlanta, the last “high-wear” track raced at, before a late issue, and he finished 15th at Homestead. I don’t have super high hopes for Suarez this weekend, but like I said, you have to differentiate yourself off of the chalk if you’re putting in a bunch of lineups on Sunday.
Ross Chastain ($6,300) – I wrote up Ross Chastain in my FanDuel article as well. This guy has just been consistent this season, and he comes in at a great price on DraftKings. Pretty much what you need from Ross Chastain on Sunday is for him to not have a bad day. He doesn’t need a great day, just a solid outing and staying out of trouble. The #42 Chevrolet rolls off from 18th here on Sunday so a 16th-place finish gets Chastain to nearly 30 DraftKings FPTS. Looking at other “high-wear” tracks this season, Ross was 17th at Homestead and came home 14th at Atlanta.
Cash Core Drivers
Kyle Larson ($11,400) – Once again, Kyle Larson has massive upside in DraftKings this weekend, as he not only has a high probability of dominator points, but he also starts 14th so there’s some place differential baked in there as well. In all reality, Larson probably should’ve been priced at about $12k this weekend, but here we are. Darlington and Chicagoland were Larson’s best tracks when he was with Ganassi and now he’s in an even better ride. I can understand being contrarian and going underweight on him in tournaments this weekend, or fading him in a single entry contest, but honestly, you’ll more than likely regret that. Eat the chalk here and go with the fastest car all season at the driver’s best track.
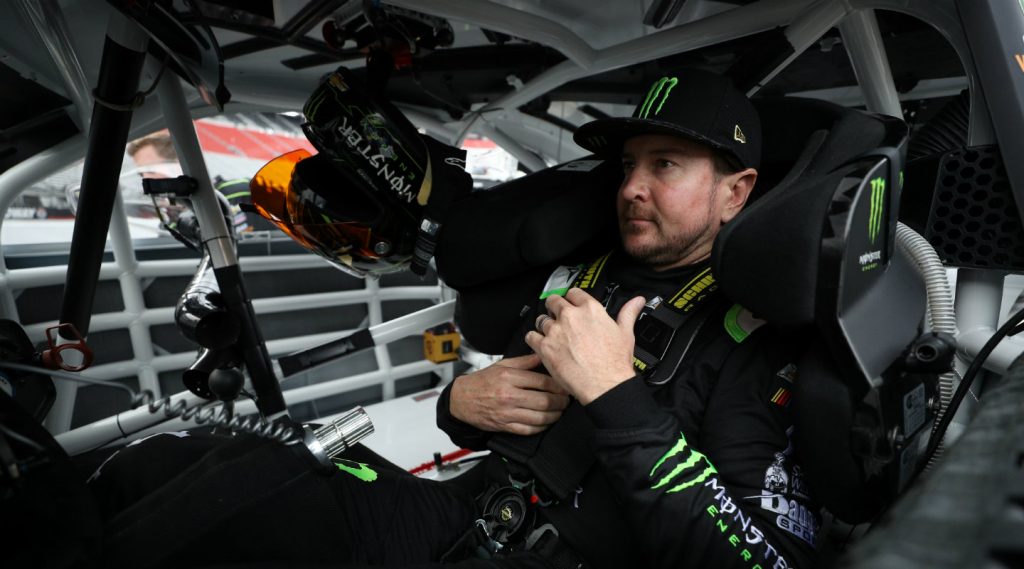
Kurt Busch ($8,400) – Yes, Kurt Busch has been very disappointing for DFS players this season, but he’s been really good at the “high-wear” race tracks and is also really good here at Darlington. At Homestead this year, Kurt overcame a late tire issue and rumbled back for an 8th-place finish and then at Atlanta he was running up inside the top 5 before Denny Hamlin wrecked him. As far as Darlington goes, Busch has finished 8th or better in six of his last eight starts and had the 3rd-most fastest laps over the last four races here. If he can get a top 10 on Sunday along with a handful of fastest laps–a.k.a. a normal Darlington race for Kurt–he’ll be a great DraftKings play.
Ryan Preece ($5,900) – It feels wrong writing this guy up as a cash core play, but here we are. In all likelihood, you’re going to need to jump down and grab someone in Ryan Preece’s price range to get a good DraftKings lineup on Sunday simply because of how Darlington is: the most talented drivers finish up front here, and those guys are all priced near the top in DFS. With Preece, though, I actually kind of view him as a safe pick in DraftKings, believe it or not. He’s finished 22nd or better in three of his four Cup Series starts here and had about a 20th-place car in the race that he didn’t before issues struck. The #37 Chevrolet finished 21st at Homestead this year, for what it’s worth. I’ll have plenty of Preece exposure on Sunday.
Darlington Goodyear 400 DraftKings Driver Projections
The following chart takes into account the very basics: the starting position and the projected finish of each driver. The projected finishes are averaged from six different ranking systems. Also factored in are projected laps led and fastest laps for each driver. You can click the headers below to sort the chart by that attribute. By default it is sorted by average projected FPTS.
| Driver | DraftKings Salary | Avg Proj FPTS | Proj Ownership | Starting Position | Ceiling Proj FPTS | Avg. Projected Finish | Dollar Per FPT |
|---|---|---|---|---|---|---|---|
| Kyle Larson | $11,400 | 89.50 | 41.64% | 14 | 125.35 | 03.2 | $127 |
| Denny Hamlin | $10,600 | 60.40 | 29.86% | 7 | 84.90 | 05.2 | $175 |
| Martin Truex Jr | $10,300 | 58.65 | 26.99% | 4 | 97.75 | 03.8 | $176 |
| Brad Keselowski | $10,000 | 55.22 | 21.00% | 1 | 82.30 | 05.7 | $181 |
| Alex Bowman | $9,400 | 50.37 | 25.44% | 19 | 63.80 | 10.2 | $187 |
| Kevin Harvick | $9,600 | 49.37 | 24.02% | 2 | 67.80 | 04.3 | $194 |
| Kyle Busch | $9,800 | 48.92 | 17.31% | 3 | 78.50 | 05.5 | $200 |
| Joey Logano | $11,100 | 47.97 | 12.47% | 12 | 55.55 | 08.0 | $231 |
| Chase Elliott | $9,200 | 46.00 | 21.91% | 6 | 72.45 | 06.5 | $200 |
| Kurt Busch | $8,400 | 42.48 | 26.50% | 17 | 57.25 | 10.0 | $198 |
| William Byron | $8,800 | 41.53 | 15.67% | 5 | 70.65 | 10.2 | $212 |
| Christopher Bell | $8,600 | 40.08 | 17.01% | 21 | 55.60 | 13.7 | $215 |
| Tyler Reddick | $7,400 | 38.47 | 24.47% | 10 | 61.20 | 11.2 | $192 |
| Erik Jones | $8,200 | 38.42 | 23.98% | 26 | 65.85 | 15.7 | $213 |
| Aric Almirola | $8,000 | 35.73 | 21.30% | 27 | 55.70 | 16.7 | $224 |
| Ryan Blaney | $9,000 | 34.35 | 14.96% | 16 | 50.50 | 13.2 | $262 |
| Ricky Stenhouse Jr | $7,600 | 33.50 | 20.70% | 28 | 50.65 | 18.7 | $227 |
| Ryan Newman | $7,200 | 33.35 | 24.91% | 20 | 49.15 | 15.8 | $216 |
| Austin Dillon | $7,500 | 30.92 | 13.75% | 9 | 45.35 | 12.2 | $243 |
| Cole Custer | $7,100 | 25.33 | 15.52% | 24 | 34.35 | 20.7 | $280 |
| Ryan Preece | $5,900 | 25.00 | 27.52% | 29 | 40.70 | 23.5 | $236 |
| Matt DiBenedetto | $7,800 | 23.12 | 8.31% | 8 | 42.30 | 14.8 | $337 |
| Chris Buescher | $6,500 | 21.00 | 10.72% | 11 | 39.95 | 17.0 | $310 |
| Bubba Wallace | $7,000 | 20.50 | 14.63% | 23 | 28.25 | 22.2 | $341 |
| Ross Chastain | $6,300 | 20.00 | 15.95% | 18 | 34.80 | 21.0 | $315 |
| Corey Lajoie | $5,700 | 18.67 | 14.11% | 30 | 27.15 | 26.7 | $305 |
| Michael McDowell | $6,100 | 17.83 | 15.61% | 13 | 38.80 | 19.3 | $342 |
| Justin Haley | $5,500 | 17.17 | 9.07% | 31 | 25.25 | 28.0 | $320 |
| Daniel Suarez | $6,700 | 14.83 | 12.33% | 15 | 32.90 | 22.2 | $452 |
| Chase Briscoe | $6,800 | 14.50 | 14.80% | 22 | 33.45 | 25.7 | $469 |
| JJ Yeley | $4,800 | 12.50 | 3.71% | 34 | 21.60 | 31.5 | $384 |
| Anthony Alfredo | $5,400 | 10.67 | 8.61% | 25 | 20.35 | 28.5 | $506 |
| Josh Bilicki | $5,000 | 08.83 | 1.65% | 37 | 21.45 | 34.0 | $566 |
| BJ McLeod | $4,700 | 08.83 | 1.94% | 32 | 13.70 | 32.0 | $532 |
| James Davison | $5,200 | 08.17 | 1.91% | 36 | 15.90 | 34.2 | $637 |
| Quin Houff | $4,500 | 05.00 | 1.35% | 35 | 16.05 | 35.2 | $900 |
| Cody Ware | $4,600 | 04.83 | 1.01% | 33 | 11.80 | 34.3 | $952 |


