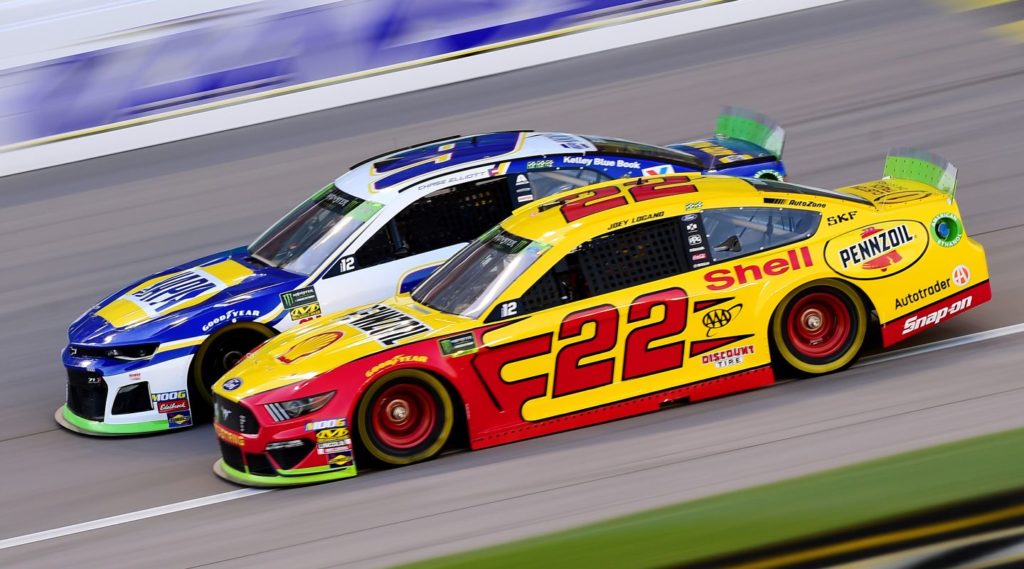
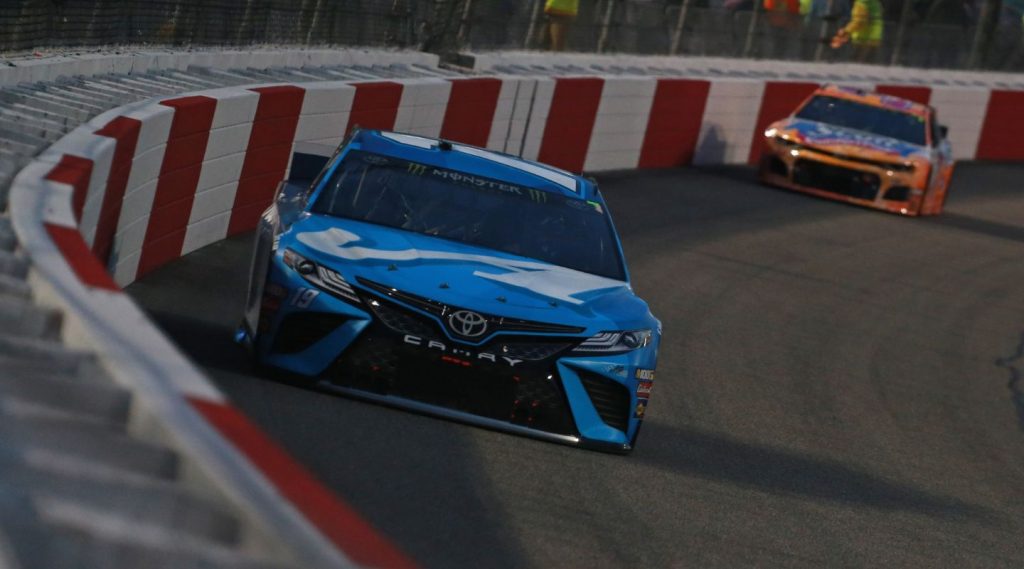
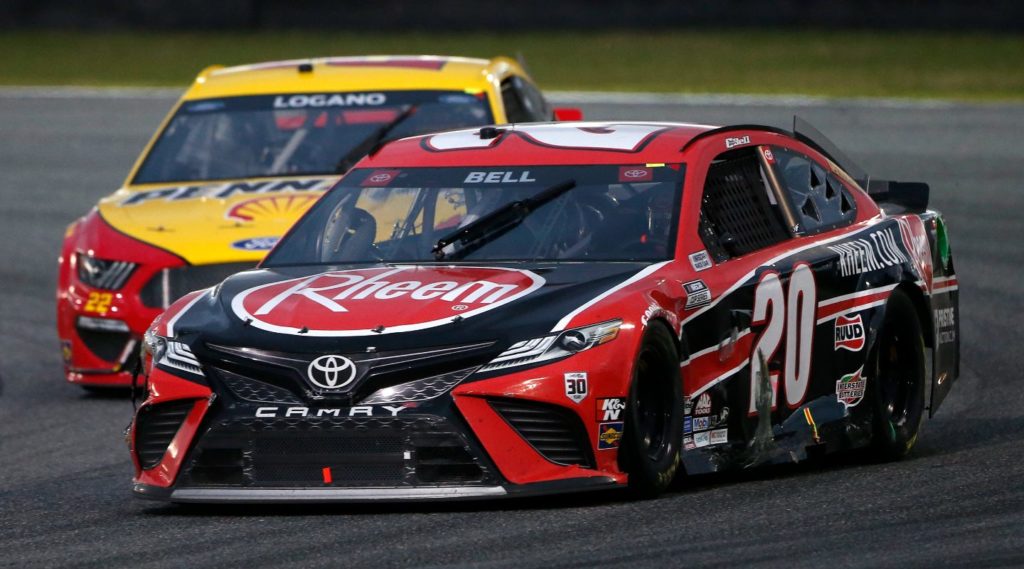
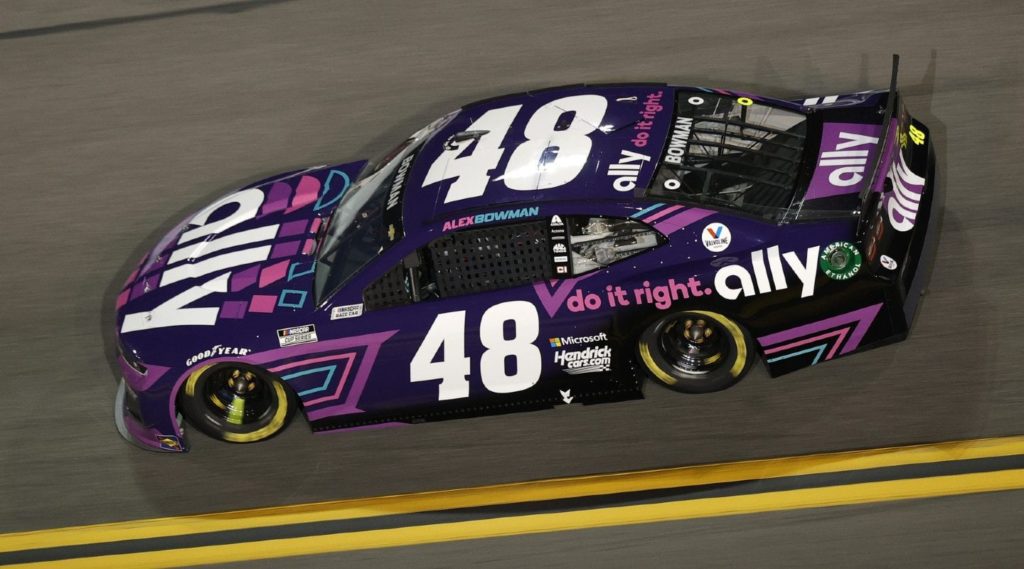
We are staying flat this weekend as the NASCAR Cup Series has yet another flat track race with the Toyota Owners 400 at Richmond Raceway this Sunday. This will be the ninth points-paying race of the season and the third one on a short, flat track. We obviously just came from Martinsville, which is a flat track, and had Phoenix last month, which is the most comparable track on the schedule to Richmond.
Martin Truex, Jr. is 2-for-2 when it comes to winning at flat tracks this season, and he’s also won two of the last three here at Richmond. It should be no surprise that my algorithm is predicting Truex to win again here on Sunday, and you can see the entire algorithm predicted finishing order for this year’s Toyota Owners 400 by clicking here.
My Richmond Fantasy & Betting Preview was posted earlier this week, and you can read some of my early thoughts heading into this race by clicking here. Also make sure to check out my FanDuel post for the Toyota Owners 400 by clicking here. There’s quite a bit of crossover in sleepers that I like on both DFS sites. Martin Truex, Jr. and Denny Hamlin are on the front row for Sunday’s race and you can check out the full starting lineup by clicking here. Now let’s goooo!!!!
Enjoy the FREE content that this site offers each week? Click here to support the site! Also, I’d highly recommend to check out the Algorithm Predicted Finishing Order for this race by clicking here!
Flat Track Track Speed Report & Loop Data Driver Averages
Same story as last week. We know who is fast on flat tracks, and we know who is fast here at Richmond. This isn’t the week or track type to over-think this. Below are the Loop Data Box Scores and Green Flag Speed reports for this year’s Phoenix and Martinsville races, as well as those two stat sheets for last year’s Richmond race.
| Race | Loop Data Box Score | Green Flag Speed |
| Phoenix (2021) | Click here | Click here |
| Martinsville (2021) | Click here | Click here |
| Richmond (2020) | Click here | Click here |
Also, below you will find the chart for flat track data from 2020 as well as a chart for Richmond specifically over the last two years. The following statistics are included in these charts. You can click on column headers to sort by that column.
- Starts
- Finish
- ARP = average running position
- DR = driver rating
- FL = fastest laps (total)
- LL = laps led (total)
- T15 = laps ran inside top 15 (total)
- Total Laps = laps completed (total)
2020 Driver Averages on Flat Tracks
| Driver | Starts | Avg Finish | ARP | DR | FL | LL | T15 | TLaps |
|---|---|---|---|---|---|---|---|---|
| Joey Logano | 6 | 03.0 | 03.9 | 123.6 | 199 | 483 | 2287 | 2329 |
| Brad Keselowski | 6 | 03.7 | 06.5 | 121.0 | 226 | 482 | 2042 | 2329 |
| Kyle Larson | 1 | 04.0 | 09.9 | 99.5 | 0 | 2 | 274 | 316 |
| Chase Elliott | 6 | 04.7 | 05.7 | 120.6 | 266 | 494 | 2228 | 2329 |
| Kevin Harvick | 6 | 08.8 | 10.3 | 104.6 | 159 | 114 | 1862 | 2328 |
| Matt DiBenedetto | 6 | 10.2 | 12.4 | 89.1 | 21 | 1 | 1573 | 2328 |
| Kurt Busch | 6 | 10.3 | 09.8 | 89.3 | 22 | 42 | 2104 | 2328 |
| Alex Bowman | 6 | 11.0 | 10.8 | 87.6 | 39 | 1 | 1706 | 2328 |
| Martin Truex Jr | 6 | 11.7 | 07.9 | 104.4 | 169 | 272 | 1985 | 2294 |
| Denny Hamlin | 6 | 12.2 | 13.0 | 90.7 | 137 | 179 | 1424 | 2325 |
| Aric Almirola | 6 | 12.7 | 13.1 | 87.9 | 62 | 28 | 1661 | 2304 |
| Ryan Blaney | 6 | 14.3 | 11.1 | 89.0 | 122 | 76 | 1395 | 2076 |
| Kyle Busch | 6 | 14.3 | 11.7 | 84.5 | 58 | 9 | 1481 | 2042 |
| William Byron | 6 | 15.7 | 13.0 | 83.6 | 31 | 0 | 1731 | 2266 |
| Cole Custer | 6 | 16.8 | 17.3 | 73.5 | 37 | 0 | 1166 | 2320 |
| Tyler Reddick | 6 | 18.8 | 16.8 | 72.7 | 24 | 0 | 1047 | 2273 |
| Bubba Wallace | 6 | 19.2 | 20.8 | 62.0 | 23 | 0 | 538 | 2323 |
| Ryan Newman | 5 | 19.6 | 17.5 | 64.6 | 11 | 0 | 735 | 2007 |
| Ricky Stenhouse Jr | 6 | 20.3 | 20.7 | 63.8 | 40 | 1 | 266 | 2321 |
| Ty Dillon | 6 | 20.7 | 23.9 | 54.5 | 2 | 0 | 112 | 2320 |
| Michael McDowell | 6 | 20.8 | 24.0 | 55.0 | 22 | 0 | 497 | 2322 |
| Christopher Bell | 6 | 21.2 | 19.9 | 67.4 | 39 | 0 | 553 | 2319 |
| Erik Jones | 6 | 21.3 | 18.1 | 68.0 | 16 | 0 | 826 | 2319 |
| Austin Dillon | 6 | 21.8 | 19.7 | 66.9 | 93 | 58 | 644 | 2038 |
| Ryan Preece | 6 | 22.2 | 23.2 | 56.8 | 3 | 0 | 238 | 2309 |
| Chris Buescher | 6 | 22.8 | 21.8 | 55.6 | 10 | 1 | 479 | 1970 |
| Ross Chastain | 1 | 23.0 | 18.0 | 64.2 | 0 | 0 | 89 | 316 |
| Daniel Suarez | 6 | 26.8 | 28.2 | 43.5 | 6 | 0 | 17 | 2308 |
| Corey LaJoie | 6 | 28.3 | 23.4 | 51.1 | 13 | 11 | 162 | 2186 |
| Joey Gase | 6 | 33.2 | 35.0 | 29.6 | 4 | 0 | 0 | 2206 |
| Josh Bilicki | 2 | 33.5 | 35.1 | 30.4 | 1 | 0 | 0 | 786 |
| James Davison | 4 | 34.0 | 34.1 | 32.0 | 3 | 0 | 3 | 1407 |
| Quin Houff | 6 | 34.0 | 35.0 | 29.2 | 2 | 0 | 1 | 2004 |
| Timmy Hill | 6 | 35.5 | 33.9 | 29.9 | 7 | 0 | 6 | 1333 |
| Garrett Smithley | 5 | 35.6 | 35.8 | 28.8 | 3 | 0 | 2 | 1287 |
2019-2020 Driver Averages At Richmond
| Martin Truex Jr | 3 | 01.3 | 03.3 | 130.4 | 89 | 295 | 1190 | 1200 |
| Brad Keselowski | 3 | 04.3 | 03.9 | 121.2 | 100 | 312 | 1195 | 1200 |
| Kyle Busch | 3 | 05.3 | 06.0 | 113.6 | 142 | 307 | 1089 | 1200 |
| Joey Logano | 3 | 05.7 | 07.6 | 105.6 | 72 | 97 | 924 | 1200 |
| Kevin Harvick | 3 | 06.3 | 06.1 | 113.0 | 110 | 71 | 1145 | 1200 |
| Denny Hamlin | 3 | 06.7 | 09.7 | 96.8 | 50 | 45 | 974 | 1199 |
| Austin Dillon | 3 | 11.0 | 12.4 | 93.9 | 85 | 55 | 762 | 1196 |
| Tyler Reddick | 1 | 11.0 | 16.2 | 76.5 | 4 | 0 | 238 | 400 |
| Chase Elliott | 3 | 11.3 | 11.2 | 88.0 | 17 | 2 | 887 | 1199 |
| Ryan Newman | 3 | 12.7 | 14.8 | 77.4 | 23 | 0 | 547 | 1197 |
| Erik Jones | 3 | 13.3 | 14.4 | 81.4 | 21 | 0 | 645 | 1198 |
| Cole Custer | 1 | 14.0 | 12.0 | 80.8 | 3 | 0 | 311 | 399 |
| Kurt Busch | 3 | 14.3 | 10.5 | 84.5 | 11 | 15 | 1034 | 1197 |
| Christopher Bell | 1 | 15.0 | 17.7 | 73.7 | 9 | 0 | 185 | 399 |
| Aric Almirola | 3 | 16.0 | 14.2 | 77.3 | 8 | 0 | 618 | 1197 |
| Ricky Stenhouse Jr | 3 | 16.7 | 16.4 | 76.0 | 53 | 0 | 410 | 1197 |
| Alex Bowman | 3 | 16.7 | 15.5 | 75.6 | 10 | 0 | 588 | 1195 |
| Matt DiBenedetto | 3 | 18.7 | 18.7 | 67.4 | 11 | 0 | 429 | 1196 |
| Daniel Suarez | 3 | 19.0 | 18.7 | 68.7 | 23 | 0 | 567 | 1195 |
| William Byron | 3 | 19.7 | 18.2 | 69.5 | 10 | 0 | 472 | 1194 |
| Ryan Blaney | 3 | 20.7 | 18.8 | 62.5 | 10 | 0 | 320 | 1195 |
| Bubba Wallace | 3 | 22.0 | 23.9 | 57.6 | 10 | 0 | 106 | 1193 |
| Kyle Larson | 2 | 22.0 | 14.3 | 72.1 | 7 | 0 | 474 | 525 |
| Ryan Preece | 3 | 23.7 | 25.1 | 51.7 | 5 | 0 | 2 | 1191 |
| Ty Dillon | 3 | 25.3 | 24.2 | 52.4 | 6 | 0 | 6 | 1190 |
| Chris Buescher | 3 | 26.0 | 22.4 | 56.0 | 15 | 0 | 240 | 1188 |
| Michael McDowell | 3 | 27.7 | 24.6 | 51.0 | 13 | 0 | 21 | 1034 |
| Corey LaJoie | 3 | 27.7 | 26.5 | 44.4 | 7 | 0 | 4 | 1187 |
| Ross Chastain | 2 | 33.5 | 33.7 | 34.9 | 32 | 0 | 0 | 659 |
| Joey Gase | 2 | 34.0 | 35.5 | 26.3 | 3 | 0 | 0 | 774 |
| Quin Houff | 3 | 34.0 | 35.0 | 27.3 | 1 | 0 | 0 | 1160 |
| James Davison | 1 | 37.0 | 36.1 | 26.5 | 0 | 0 | 0 | 385 |
| Timmy Hill | 1 | 38.0 | 37.0 | 27.9 | 1 | 0 | 1 | 100 |
Potential Dominators
We go from 500 laps at Martinsville last weekend to 400 laps here at Richmond this weekend, and even though we won’t have as many dominator points available in DraftKings, it’s still important to nail those guys in your lineup. Typically we see at least two, maybe three main dominators in a Richmond race, and usually several “mini dominators.” Last year, Brad Keselowski led 192 laps followed by Austin Dillon (55 laps led) and Denny Hamlin and Joey Logano (45 laps led each).
In September 2019 here at Richmond, it was Kyle Busch with 202 laps led followed by Martin Truex, Jr. with 109 laps led and Brad Keselowski with 89 laps led. The spring 2019 race here had Truex leading 189 laps followed by Kyle Busch with 101 and Joey Logano with 52. Also leading laps in that race were Keselowski (31 laps led) and Harvick (30 laps led).
With lineup construction, you’ll need to target at least two dominators, maybe three once again. It’s rare to see a one dominator race at Richmond, with the last time that happening coming back in 2015 when Matt Kenseth led 352 of the 400 laps en route to victory. Here are the drivers that I am going to be targeting (for the most part) as far as the dominator pool goes for this weekend’s race:
- Martin Truex, Jr.
- Denny Hamlin
- Kyle Larson
- Joey Logano
- Chase Elliott
- Brad Keselowski
Possible “surprise” dominators this week include: Kyle Busch, William Byron, Christopher Bell, and Austin Dillon.
GPP / Tournament Picks
Joey Logano ($10,600) – Obviously the projections love Truex, Hamlin, and Larson this weekend, but don’t count out Joey Logano from dominating a portion of this race. Don’t forget that Joey led 143 laps at Phoenix earlier this year before finishing 2nd, and here at Richmond he’s ended up 4th or better in five of his last seven starts. The Penske Fords are great at shorter flat tracks and even though Logano and Keselowski struggled at Martinsville last weekend, this is a new race, and they should be back to their normal selves on Sunday.
Christopher Bell ($7,800) – I love this $7,000 to $8,000 price range on DraftKings this weekend, which is noteworthy because with most weeks I typically don’t have too much exposure in here. But this week I definitely will. As I mentioned in my FanDuel article (click here), I love Christopher Bell all around this week. I think this #20 Toyota has top 5 upside and Bell could surprise some people and get dominator points on Sunday as well. He was absolutely dominant here in the Xfinity Series and now he’s in a great Cup car with a great crew chief that has one hell of a record at this track. On flat tracks this year, CBell is 2-for-2 in getting top 10 finishes and also has double-digit fastest laps in both.
Ricky Stenhouse, Jr. ($6,200) – Originally, I had Austin Dillon ($7,500) in this spot but figured that there will be plenty of people talking about AD this weekend, so let’s talk about Stenhouse. My projections love Ricky Stenhouse, Jr. this weekend. Somehow, some way, the guy that we know as “Wrecky” has yet to wreck out this season, and even though he’s technically “due” for that to happen, he’s a really nice value play here at $6,200 in DraftKings. Flat tracks have always been a strength for Stenhouse, and here at Richmond we’ve seen him gamble on pit strategy and put up chunks of fastest laps because of it (like last year, when he had 31 fastest laps). If Stenhouse does that again here on Sunday, that’s even better for his $6,200 price tag. But just looking at Ricky from a racing perspective and not taking those into account, he’s finished between 13th and 18th in each of his last four starts at Richmond and 19th or better in eight of his last ten. This season, Stenhouse hasn’t finished worse than 15th since the Daytona Road Course when he ended up 18th–and that’s his worst finish all year thus far.
Cash Core Drivers
Kyle Larson ($10,300) – At this point I’m just going “all in” on Kyle Larson this weekend. In case you missed my article on him from Monday (click here to read that) or really anything from me about Larson lately, here’s the rule of thumb: at tracks where he was good with Chip Ganassi Racing equipment, he’ll be great in his Hendrick equipment. That’s Richmond. Larson has finished 7th or better in five of his last seven starts at this track, including a win back in 2017 as well as a 2nd-place finish back in 2016. He’s put up 46+ fastest laps in three of the last five Cup Series races with the only exceptions being the Bristol Dirt Race (he wrecked out) and Martinsville last week–not his best track by any means, and he still put up 21 fastest laps. Larson can win this race on Sunday and has major dominator upside as well.
Alex Bowman ($8,800) – You could also go Austin Cindric ($8,600) here if you want, since there’s so much place differential upside with him, but my projections like Alex Bowman significantly better than Cindric this week, so I’ll roll with him in cash lineups. Look at it this way, just looking at base DraftKings finish/place differential points, Bowman scores 43 FPTS with a 12th-place finish while Cindric has to get up to 18th to score 45 FPTS. I like Bowman to challenge for a top 10 or maybe even a top 5 a lot more than I like Cindric to possibly crack the top 15, not to mention, Bowman has a better chance of grabbing some dominator points on Sunday. Last year, Bowman started 4th and finished 9th here at Richmond in a somewhat lackluster race. I am a little concerned about Bowman having only one finish better than 13th in the last five Cup Series races, but him priced at $8,800 gives him the opportunity to kill it in value on DraftKings this weekend.
Daniel Suarez ($6,600) – Yeah, no problem running Daniel Suarez in cash games this week–and that’s coming from a guy that dogs on this driver any chance he gets. Like Larson, Suarez was solid here in his old equipment–three top 10s, no finish worse than 18th in six races–and we all know the potential that this #99 Chevrolet has shown this year. This weekend, Suarez starts 27th and is priced down (for some reason) at $6,600. On Sunday, don’t be surprised if Suarez competes for another mid-teens finish in the Toyota Owners 400.
Richmond Toyota Owners 400 DraftKings Driver Projections
The following chart takes into account the very basics: the starting position and the projected finish of each driver. The projected finishes are averaged from six different ranking systems. Also factored in are projected laps led and fastest laps for each driver. You can click the headers below to sort the chart by that attribute. By default it is sorted by average projected FPTS.
| Driver | DraftKings Salary | Avg Proj FPTS | Proj Ownership | Starting Position | Ceiling Proj FPTS | Avg. Projected Finish | Dollar Per FPT |
|---|---|---|---|---|---|---|---|
| Martin Truex Jr | $11,400 | 94.90 | 32.41% | 1 | 170.35 | 02.2 | $120 |
| Denny Hamlin | $11,000 | 94.28 | 21.96% | 2 | 138.80 | 02.5 | $117 |
| Kyle Larson | $10,300 | 83.17 | 24.92% | 6 | 138.50 | 04.2 | $124 |
| Joey Logano | $10,600 | 67.28 | 20.90% | 5 | 112.20 | 02.7 | $158 |
| Brad Keselowski | $12,000 | 65.18 | 22.79% | 20 | 85.10 | 05.7 | $184 |
| Alex Bowman | $8,800 | 54.42 | 29.98% | 24 | 79.45 | 10.5 | $162 |
| Chase Elliott | $9,700 | 48.85 | 28.29% | 3 | 89.30 | 06.5 | $199 |
| Kevin Harvick | $9,400 | 45.57 | 17.99% | 9 | 71.85 | 07.0 | $206 |
| Kyle Busch | $10,000 | 43.18 | 15.34% | 10 | 78.75 | 08.3 | $232 |
| Austin Cindric | $8,600 | 42.83 | 27.41% | 38 | 59.90 | 21.5 | $201 |
| William Byron | $8,500 | 42.30 | 16.10% | 4 | 66.35 | 08.2 | $201 |
| Christopher Bell | $7,800 | 40.83 | 18.19% | 8 | 73.75 | 09.7 | $191 |
| Kurt Busch | $8,300 | 40.35 | 18.90% | 17 | 55.95 | 10.8 | $206 |
| Austin Dillon | $7,500 | 37.87 | 20.47% | 11 | 85.25 | 12.8 | $198 |
| Aric Almirola | $8,200 | 37.17 | 16.44% | 22 | 43.25 | 14.8 | $221 |
| Matt DiBenedetto | $8,000 | 35.90 | 20.70% | 16 | 44.40 | 12.7 | $223 |
| Ryan Newman | $7,000 | 35.07 | 25.08% | 19 | 48.40 | 15.0 | $200 |
| Erik Jones | $7,600 | 33.83 | 14.63% | 30 | 47.00 | 19.8 | $225 |
| Daniel Suarez | $6,600 | 33.00 | 27.70% | 27 | 46.70 | 21.0 | $200 |
| Ricky Stenhouse Jr | $6,200 | 32.60 | 17.17% | 14 | 50.80 | 14.5 | $190 |
| Cole Custer | $6,800 | 30.33 | 16.29% | 21 | 45.00 | 17.8 | $224 |
| Ryan Blaney | $9,100 | 29.92 | 15.69% | 7 | 53.25 | 12.5 | $304 |
| Tyler Reddick | $7,200 | 26.35 | 12.98% | 13 | 50.45 | 16.3 | $273 |
| Chase Briscoe | $6,400 | 26.23 | 19.60% | 26 | 32.35 | 22.5 | $244 |
| Corey Lajoie | $5,700 | 22.67 | 13.08% | 36 | 28.00 | 27.8 | $251 |
| Ryan Preece | $5,600 | 22.33 | 15.35% | 25 | 34.00 | 23.0 | $251 |
| Ross Chastain | $6,000 | 21.67 | 10.46% | 18 | 31.00 | 19.8 | $277 |
| Justin Haley | $5,200 | 17.83 | 6.61% | 34 | 26.00 | 29.2 | $292 |
| Michael McDowell | $5,800 | 16.67 | 14.10% | 23 | 32.00 | 24.8 | $348 |
| Anthony Alfredo | $5,400 | 15.00 | 11.35% | 29 | 25.00 | 28.7 | $360 |
| Bubba Wallace | $7,300 | 14.83 | 8.82% | 15 | 28.00 | 21.3 | $492 |
| BJ McLeod | $5,100 | 12.33 | 3.01% | 35 | 17.00 | 32.0 | $414 |
| Chris Buescher | $6,100 | 11.68 | 7.94% | 12 | 30.60 | 21.5 | $522 |
| Garrett Smithley | $5,300 | 09.17 | 2.96% | 37 | 16.00 | 34.7 | $578 |
| Cody Ware | $4,900 | 06.17 | 0.66% | 33 | 10.00 | 34.0 | $795 |
| Josh Bilicki | $4,700 | 04.17 | 0.86% | 31 | 13.00 | 34.3 | $1,128 |
| Quin Houff | $4,800 | 00.67 | 1.56% | 32 | 16.00 | 35.5 | $7,200 |
| James Davison | $4,600 | 00.40 | 0.51% | 28 | 05.90 | 34.7 | $11,500 |


