Atlanta Motor Speedway. Some of the best racing on the schedule thanks to its worn-out surface, putting more control in the driver’s hands and relying on his ability to maintain his tires through the run. The most similar track to Atlanta is Homestead, and we just raced there a few weeks ago. It’s a good idea to look at those numbers (they’re linked below), but please note that Homestead was a late-afternoon-transition-into-night race, and Atlanta is only going to end under the lights if there’s a rain delay.
My Atlanta Fantasy/Betting Preview was posted earlier this week, and you can read some of my early thoughts heading into this race by clicking here. Also make sure to read my FanDuel post for the Folds of Honor QuiKTrip 500 by clicking here. There’s quite a bit of crossover in sleepers that I like on both DFS sites. Brad Keselowski and Kyle Larson are on the front row for Sunday’s race and you can check out the full starting lineup by clicking here. Now let’s gooo!!!
Enjoy the FREE content that this site offers each week? Buy me a Miller Lite for this weekend’s race by clicking here and donating. Also, I’d highly recommend to check out the Algorithm Predicted Finishing Order for this race by clicking here!
“High-Wear” Intermediate Track Speed Report & Loop Data Driver Averages
We already have two intermediate track races under our belt this season, with Homestead (“high-wear”) and Las Vegas (“low-wear”) both taking place over the last few weeks. As I mentioned in my Preview article for this race, it’s definitely worth weighing performances from both of those races, but just do so with a grain of salt. Homestead is the most similar track to Atlanta, but that race started in the late afternoon and ended at night, so there were more factors in play than what we’ll see at Atlanta on Sunday. And Las Vegas is a “low-wear” track, so while it is also 1.5 miles in length, it doesn’t have the tire fall-off and kind of takes some pressure off their drivers and his skills.
Still, here are the Loop Data Box Score and Green Flag Speed links for those races.
| 2021 Race | Loop Data Box Score | Green Flag Speed |
| Homestead-Miami Speedway | Click here | Click here |
| Las Vegas Motor Speedway | Click here | Click here |
In addition to that data, below you will find the chart for “high-wear” tracks in 2020 as well as a chart for Atlanta specifically over the last two years. Keep in mind that we only race at Atlanta once per year, so one or two bad races during that time frame can make a driver seem worse here than he actually is (and vice versa). The following statistics are included in these charts. You can click on column headers to sort by that column.
- Starts
- Finish
- ARP = average running position
- DR = driver rating
- FL = fastest laps (total)
- LL = laps led (total)
- T15 = laps ran inside top 15 (total)
- Total Laps = laps completed (total)
2020 Driver Averages on “High-Wear” Tracks
| Denny Hamlin | 6 | 05.2 | 6.10 | 111.1 | 94 | 168 | 1565 | 1660 |
| Kevin Harvick | 6 | 06.8 | 7.22 | 112.8 | 148 | 352 | 1479 | 1659 |
| Kyle Busch | 6 | 07.5 | 9.89 | 97.9 | 64 | 9 | 1334 | 1659 |
| Brad Keselowski | 6 | 08.7 | 11.01 | 95.7 | 71 | 99 | 1306 | 1660 |
| Kurt Busch | 6 | 08.7 | 11.86 | 90.9 | 57 | 6 | 1233 | 1659 |
| Alex Bowman | 6 | 09.5 | 7.36 | 108.9 | 144 | 152 | 1526 | 1658 |
| Aric Almirola | 6 | 09.7 | 12.08 | 91.1 | 19 | 0 | 1165 | 1659 |
| Martin Truex Jr | 6 | 11.2 | 7.21 | 107.0 | 176 | 280 | 1480 | 1659 |
| Tyler Reddick | 6 | 12.3 | 14.06 | 83.5 | 69 | 3 | 931 | 1658 |
| Austin Dillon | 6 | 12.5 | 16.23 | 76.2 | 14 | 0 | 669 | 1658 |
| Chase Elliott | 6 | 12.7 | 6.61 | 107.1 | 104 | 195 | 1598 | 1652 |
| Erik Jones | 6 | 12.7 | 12.33 | 91.0 | 66 | 27 | 1288 | 1656 |
| Joey Logano | 6 | 12.7 | 12.83 | 86.4 | 43 | 56 | 1150 | 1658 |
| Ryan Blaney | 6 | 14.5 | 12.85 | 93.9 | 98 | 126 | 991 | 1658 |
| Matt DiBenedetto | 6 | 16.0 | 15.84 | 77.2 | 9 | 0 | 865 | 1658 |
| Ryan Newman | 5 | 17.6 | 19.02 | 69.8 | 15 | 5 | 378 | 1455 |
| William Byron | 6 | 18.2 | 18.23 | 78.9 | 12 | 4 | 887 | 1634 |
| Ricky Stenhouse Jr | 5 | 19.4 | 20.15 | 62.6 | 11 | 6 | 402 | 1363 |
| Michael McDowell | 6 | 19.5 | 22.90 | 60.2 | 5 | 0 | 72 | 1658 |
| Cole Custer | 6 | 20.7 | 20.70 | 63.0 | 5 | 0 | 225 | 1655 |
| Kyle Larson | 1 | 21.0 | 23.30 | 66.4 | 1 | 0 | 32 | 199 |
| Christopher Bell | 6 | 22.2 | 20.56 | 62.6 | 15 | 0 | 338 | 1521 |
| Bubba Wallace | 6 | 22.7 | 21.95 | 60.3 | 3 | 3 | 205 | 1507 |
| Ross Chastain | 2 | 23.0 | 27.56 | 51.7 | 1 | 0 | 43 | 560 |
| Chris Buescher | 6 | 23.7 | 21.78 | 59.8 | 18 | 0 | 194 | 1649 |
| Ty Dillon | 6 | 24.7 | 24.40 | 51.9 | 2 | 8 | 82 | 1650 |
| Ryan Preece | 6 | 26.0 | 22.93 | 58.3 | 7 | 0 | 214 | 1515 |
| Daniel Suarez | 6 | 27.8 | 28.82 | 42.9 | 2 | 1 | 15 | 1640 |
| Corey LaJoie | 6 | 29.5 | 28.05 | 45.2 | 2 | 0 | 19 | 1514 |
| Quin Houff | 6 | 32.2 | 33.64 | 33.0 | 0 | 0 | 2 | 1466 |
| Joey Gase | 6 | 33.2 | 34.96 | 31.4 | 4 | 0 | 0 | 1603 |
| Josh Bilicki | 4 | 34.3 | 34.58 | 32.2 | 2 | 0 | 0 | 1200 |
| Timmy Hill | 6 | 35.2 | 36.18 | 29.2 | 11 | 0 | 2 | 1486 |
| BJ McLeod | 4 | 37.5 | 36.76 | 25.6 | 1 | 0 | 3 | 474 |
| James Davison | 1 | 39.0 | 37.60 | 25.3 | 0 | 0 | 0 | 162 |
2019-2020 Driver Averages At Atlanta
| Driver | Starts | Avg Finish | ARP | DR | FL | LL | T15 | TLaps |
|---|---|---|---|---|---|---|---|---|
| Martin Truex Jr | 2 | 02.5 | 03.1 | 128.8 | 91 | 69 | 650 | 650 |
| Kevin Harvick | 2 | 02.5 | 03.7 | 129.6 | 77 | 196 | 644 | 650 |
| Kyle Busch | 2 | 04.0 | 07.3 | 106.2 | 49 | 7 | 601 | 650 |
| Kurt Busch | 2 | 04.5 | 10.0 | 102.7 | 18 | 2 | 587 | 650 |
| Brad Keselowski | 2 | 05.0 | 09.4 | 104.1 | 47 | 38 | 569 | 650 |
| Denny Hamlin | 2 | 08.0 | 07.5 | 99.0 | 13 | 0 | 627 | 650 |
| Kyle Larson | 1 | 12.0 | 06.1 | 117.2 | 54 | 142 | 266 | 325 |
| Clint Bowyer | 2 | 12.5 | 07.2 | 102.3 | 34 | 58 | 616 | 649 |
| Aric Almirola | 2 | 12.5 | 13.9 | 83.6 | 26 | 36 | 307 | 649 |
| Ryan Blaney | 2 | 13.0 | 08.4 | 99.8 | 38 | 43 | 597 | 649 |
| Chase Elliott | 2 | 13.5 | 10.3 | 88.2 | 11 | 26 | 534 | 649 |
| Alex Bowman | 2 | 13.5 | 14.6 | 79.2 | 6 | 0 | 341 | 649 |
| Ryan Newman | 2 | 13.5 | 16.7 | 73.7 | 1 | 0 | 285 | 649 |
| Ricky Stenhouse Jr | 2 | 15.5 | 15.5 | 83.9 | 10 | 1 | 405 | 648 |
| Jimmie Johnson | 2 | 15.5 | 16.6 | 74.8 | 3 | 0 | 318 | 648 |
| Chris Buescher | 2 | 15.5 | 19.6 | 66.8 | 2 | 0 | 154 | 649 |
| Austin Dillon | 2 | 16.0 | 20.7 | 64.3 | 2 | 0 | 73 | 648 |
| Tyler Reddick | 1 | 16.0 | 15.2 | 75.1 | 1 | 0 | 133 | 324 |
| Joey Logano | 2 | 16.5 | 10.9 | 89.8 | 47 | 32 | 496 | 649 |
| Erik Jones | 2 | 17.5 | 14.9 | 81.0 | 17 | 0 | 402 | 647 |
| Christopher Bell | 1 | 18.0 | 17.9 | 71.6 | 1 | 0 | 84 | 324 |
| Cole Custer | 1 | 19.0 | 21.9 | 62.4 | 1 | 0 | 0 | 324 |
| Daniel Suarez | 2 | 20.5 | 21.5 | 61.7 | 1 | 0 | 295 | 641 |
| John H. Nemechek | 1 | 23.0 | 25.4 | 52.5 | 0 | 0 | 7 | 324 |
| Bubba Wallace | 2 | 24.0 | 24.5 | 52.9 | 1 | 0 | 41 | 646 |
| William Byron | 2 | 25.0 | 26.9 | 52.8 | 2 | 0 | 43 | 638 |
| Matt DiBenedetto | 2 | 25.5 | 19.1 | 62.7 | 4 | 0 | 210 | 646 |
| Ty Dillon | 2 | 27.0 | 25.8 | 48.6 | 1 | 0 | 6 | 645 |
| Corey LaJoie | 2 | 28.0 | 28.4 | 43.7 | 8 | 0 | 6 | 642 |
| Ryan Preece | 2 | 30.5 | 22.6 | 55.1 | 6 | 0 | 59 | 594 |
| Michael McDowell | 2 | 30.5 | 26.7 | 47.6 | 5 | 0 | 16 | 546 |
| Ross Chastain | 1 | 31.0 | 33.4 | 32.8 | 2 | 0 | 0 | 313 |
| Quin Houff | 1 | 32.0 | 32.7 | 35.2 | 0 | 0 | 0 | 314 |
| Joey Gase | 1 | 38.0 | 37.1 | 26.3 | 0 | 0 | 0 | 308 |
| Timmy Hill | 1 | 39.0 | 37.9 | 27.5 | 2 | 0 | 0 | 259 |
What About Kevin Harvick?
Whenever we come to Atlanta Motor Speedway, Kevin Harvick is usually the “okay, we have our first driver locked in, now who else?” He’s been that good here. We’re talking an average of 51.9 fastest laps per race over the last eight races here. A total of 1,111 laps led, which comes out to a ridiculous average of 138.9 per race, over that same span. That’s 58.08 DraftKings dominator FPTS per race without even taking into consideration finishing points and place differential points!
But the biggest question heading into Sunday’s Folds of Honor QuikTrip 500 is whether that Kevin Harvick is going to show up. Because that Kevin Harvick hasn’t even peeked his head around the corner yet this year. That Kevin Harvick is still in the shower while everyone else is on their third beer at the bar.
In my opinion, I think this will finally be the race that we see Kevin Harvick have just an “okay” race–by his standards. Don’t get me wrong, he’s still a top 5 contender (we saw that at Homestead), but I don’t think this #4 Ford has the speed the beat guys like Martin Truex, Jr., Kyle Larson, and Brad Keselowski on Sunday. So in order for Kevin Harvick to grab those dominator points, at least two of those will have to run into trouble. It’s certainly possible, but it’s not guarantee.
With that being said, as you can see in my Projections chart below, I have Harvick projected with the 3rd-highest ceiling of all drivers. There’s still that dominator potential there, and you shouldn’t completely fade him. I just wouldn’t recommend, by any means, going 70-80% exposure with him, like I have personally done in the past for most Atlanta races.
GPP / Tournament Picks
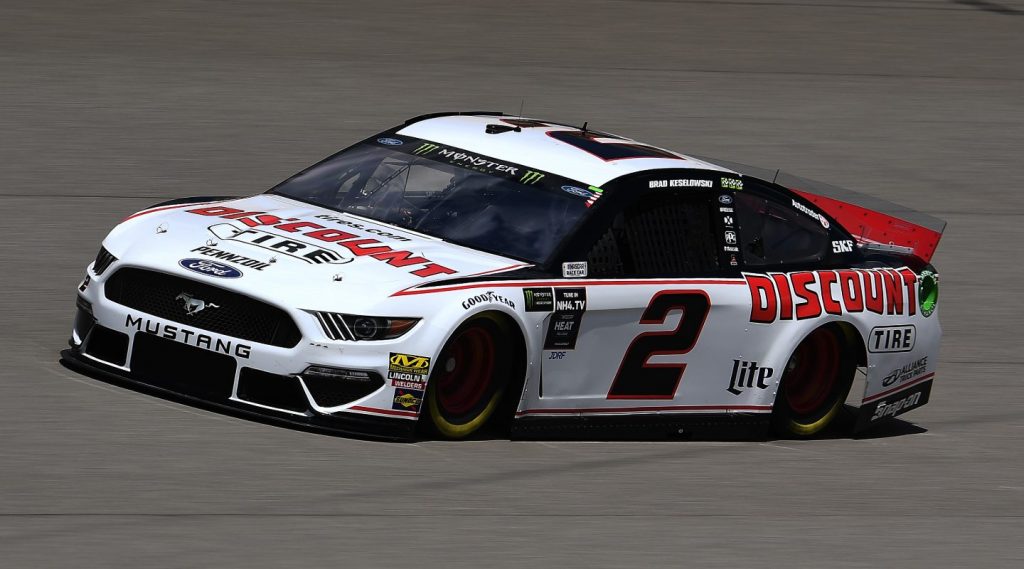
Brad Keselowski ($10,200) – Repeat after me: do not put too much stock into the 2021 Homestead and Las Vegas race speeds. Okay, now that we got that warning out of the way, let’s look at how Brad Keselowski has done at Homestead and Las Vegas this year. In addition to the best Green Flag Speed in those two races, Kez also has the 3rd-best average running position. And my favorite part: he put up 28 fastest laps at Homestead and 30 fastest laps at Las Vegas. And here at Atlanta, Keselowski has put up 19 and 28 fastest laps over the last two races. Also, over the last four races at this track, there have been two winners: Kevin Harvick (twice) and Brad Keselowski (twice). With my Projections (below), I don’t have Kez getting a ton of dominator points, and he’s still the 4th-highest projected scoring driver. I love being overweight on him in tournaments, as I do all of Penske really, as Joey Logano ($9,400) and Ryan Blaney ($9,200) have high-scoring potential as well, but I think Kez is the better play between the three in tournaments.
EDIT ON SATURDAY MORNING: The more I’m thinking about, the more and more I’m liking Ryan Blaney this week. He has top 5 upside on Sunday and has the 7th-most fastest laps at Atlanta over the last two years.
Alex Bowman ($8,800) – As unofficial leader of the Alex Bowman Fan Club, I simply cannot keep him off of my tournament picks list. While his teammate, William Byron ($9,000), is sure to get some attention this weekend thanks to his dominating performance at Homestead, I like Bowman a little bit better. First, he’s priced right there above the chalk, Austin Cindric ($8,600) and Tyler Reddick ($8,400), so that will keep Bowman’s ownership down. Plus, Bowman has been downright disappointing this season, and has killed the weeks for many Fantasy NASCAR players–myself included. But to quote a great Sting song, “If I ever lose my faith in you, there’d be nothing left for me to do.” Last year on “high-wear” race track, Bowman had the 3rd-best average running position, the 5th-most fastest laps, and the 2nd-most laps led. In the two intermediate races this year, Bowman has the 6th-best average running position and the 7th-best Green Flag Speed. You can jump on this Bowman train with me or stay away, but just to let you know…
Chris Buescher ($6,000) – My projections love Chris Buescher this weekend even though he his average projected finish (17.5) is slightly worse than his starting position (17th). But at just a $6,000 salary, you’re getting a driver that could have top 10 potential on Sunday, and who should be quite low-owned. Buescher’s record here at Atlanta isn’t great–only one top 20 finish in five starts–but that’s just another reason people will lay off of him. Another thing to consider: Buescher hasn’t finished worse than 19th this season except for the Daytona 500, which ironically was the last time I was high on him as well. Will the #JordanJinx strike again? Let’s hope not…
Cash Core Drivers
Kyle Larson ($10,400) – The #JordanJinx struck again last weekend at Phoenix, as Kyle Larson was nabbed for two speeding penalties after having to start from the rear due to inspection issues. And guess what? He still had a race winning car. That #5 Chevrolet has been bad fast all season long and the last time Kyle Larson raced here at Atlanta, he led 142 laps and posted 54 fastest laps before a, you guessed it, speeding penalty derailed his day. Hey, it’s still not as bad as Denny Hamlin. This weekend, Larson is a race win contender and starts 6th, so there’s a bit of place differential potential there as well. He finished 4th at Homestead a few weeks ago and we all know what Larson did to the field at Las Vegas…
Want to see my optimal lineups? Click here for this week’s Optimal post for Atlanta.
Austin Cindric ($8,600) – One downfall of this starting lineup format is that when someone like Austin Cindric jumps up to the Cup Series for a race, he’s automatically going to start in the back. As is the case this weekend. Cindric starts dead last for Sunday’s Folds of Honor QuikTrip 500 but is in a third Penske car, so there’s no doubt he has the horsepower to challenge for a solid finish (at least a top 20). You can get cute and try and intentionally fade Cindric since pretty much everyone will have him in their cash lineup, but that’s a strategy that’s more for tournaments.
Anthony Alfredo ($5,500) – Thus far in 2021, Anthony Alfredo has really only had two bad races: the Daytona 500 when his car went up in flames, and then Phoenix last weekend when Cody Ware decided to punt the #38 Ford into the wall. And now we’re stuck with Alfredo starting 32nd at Atlanta on Sunday and priced at only $5,500 on DraftKings. Chalk city. At Homestead a few weeks ago, Alfredo was able to stay out of trouble and finish 24th, and he did the exact same thing at Las Vegas. Last year at Atlanta, John Hunter Nemechek drove this #38 Ford to a 23rd-place finish, for what it’s worth.
Atlanta Folds of Honor QuikTrip 500 DraftKings Driver Projections
NEW THIS WEEK: Ownership Projections!
The following chart takes into account the very basics: the starting position and the projected finish of each driver. The projected finishes are averaged from six different ranking systems. Also factored in are projected laps led and fastest laps for each driver. You can click the headers below to sort the chart by that attribute. By default it is sorted by average projected FPTS.
| Driver | DraftKings Salary | Avg Proj FPTS | Proj Ownership | Starting Position | Ceiling Proj FPTS | Avg. Projected Finish | Dollar Per FPT |
|---|---|---|---|---|---|---|---|
| Martin Truex Jr | $9,600 | 81.73 | 23.43% | 2 | 116.60 | 02.3 | $117 |
| Kyle Larson | $10,400 | 79.65 | 29.92% | 6 | 106.75 | 04.3 | $131 |
| Brad Keselowski | $10,200 | 57.97 | 18.64% | 4 | 81.35 | 03.8 | $176 |
| Kevin Harvick | $11,000 | 57.70 | 32.96% | 7 | 93.05 | 05.3 | $191 |
| Denny Hamlin | $10,000 | 56.58 | 28.83% | 1 | 82.45 | 03.7 | $177 |
| William Byron | $9,000 | 49.92 | 14.40% | 9 | 74.50 | 08.8 | $180 |
| Ryan Blaney | $9,200 | 49.78 | 21.44% | 10 | 59.60 | 08.5 | $185 |
| Kyle Busch | $10,700 | 49.02 | 19.97% | 19 | 64.65 | 10.2 | $218 |
| Alex Bowman | $8,800 | 44.40 | 15.33% | 14 | 63.45 | 10.0 | $198 |
| Tyler Reddick | $8,400 | 44.10 | 35.47% | 29 | 59.30 | 16.5 | $190 |
| Chase Elliott | $9,800 | 42.75 | 24.10% | 5 | 69.30 | 06.8 | $229 |
| Kurt Busch | $8,300 | 42.38 | 17.01% | 11 | 56.95 | 08.0 | $196 |
| Austin Cindric | $8,600 | 41.67 | 43.96% | 39 | 65.40 | 21.3 | $206 |
| Ryan Newman | $7,100 | 38.92 | 25.38% | 28 | 51.95 | 17.8 | $182 |
| Joey Logano | $9,400 | 37.58 | 16.39% | 3 | 70.75 | 07.5 | $250 |
| Christopher Bell | $7,800 | 33.75 | 13.21% | 8 | 48.05 | 10.5 | $231 |
| Cole Custer | $7,600 | 33.37 | 22.41% | 27 | 55.50 | 20.7 | $228 |
| Austin Dillon | $7,300 | 32.52 | 7.55% | 13 | 42.40 | 12.7 | $225 |
| Aric Almirola | $8,000 | 32.32 | 15.22% | 16 | 48.75 | 15.2 | $248 |
| Matt DiBenedetto | $8,100 | 32.23 | 13.17% | 20 | 50.00 | 16.7 | $251 |
| Erik Jones | $7,000 | 29.73 | 14.68% | 22 | 40.80 | 18.3 | $235 |
| Chris Buescher | $6,000 | 29.08 | 10.01% | 17 | 48.65 | 17.5 | $206 |
| Ricky Stenhouse Jr | $6,300 | 28.57 | 8.91% | 12 | 50.95 | 14.7 | $221 |
| Chase Briscoe | $6,800 | 27.85 | 14.92% | 24 | 40.60 | 20.3 | $244 |
| Michael McDowell | $6,100 | 24.90 | 12.14% | 18 | 41.05 | 18.8 | $245 |
| Ross Chastain | $6,600 | 24.62 | 5.14% | 21 | 44.75 | 20.2 | $268 |
| Anthony Alfredo | $5,500 | 22.00 | 35.72% | 32 | 31.35 | 26.2 | $250 |
| Ryan Preece | $5,800 | 20.33 | 7.34% | 23 | 37.80 | 23.2 | $285 |
| Daniel Suarez | $6,500 | 19.17 | 15.73% | 25 | 37.35 | 24.8 | $339 |
| Corey Lajoie | $5,300 | 18.67 | 9.31% | 30 | 24.90 | 27.0 | $284 |
| Bubba Wallace | $7,400 | 14.17 | 9.08% | 15 | 35.60 | 22.2 | $522 |
| Josh Bilicki | $4,800 | 11.17 | 2.32% | 37 | 16.00 | 33.7 | $430 |
| Justin Haley | $5,600 | 11.00 | 4.86% | 26 | 21.35 | 28.8 | $509 |
| Joey Gase | $5,000 | 11.00 | 2.24% | 36 | 18.00 | 33.2 | $455 |
| Quin Houff | $4,700 | 10.50 | 1.92% | 35 | 17.00 | 33.0 | $448 |
| Cody Ware | $4,500 | 09.00 | 1.87% | 33 | 15.00 | 33.2 | $500 |
| Timmy Hill | $4,900 | 07.67 | 1.72% | 38 | 13.00 | 36.0 | $639 |
| BJ McLeod | $4,600 | 07.67 | 2.00% | 31 | 15.00 | 32.5 | $600 |
| James Davison | $5,100 | 03.50 | 1.29% | 34 | 09.00 | 36.2 | $1,457 |


