With Homestead-Miami complete (click here for my “what we learned” from that race) the NASCAR Cup Series is off to Las Vegas Motor Speedway on Sunday afternoon for the Pennzoil 400. Joey Logano is the defending winner of this race for the last two years in a row, but has a bit to overcome on Sunday since he’s starting back in 15th thanks to an awful performance last weekend.
My Fantasy/Betting Preview for this race went up earlier this week, and you can check it out by clicking here. Also, as always, it is recommended to check out my FanDuel post for the Pennzoil 400 by clicking here. Kevin Harvick and William Byron will lead them to the green on Sunday and you can see the full starting lineup by clicking here. Now let’s goooo!!!!
Enjoy the FREE content that this site offers each week? Consider donating to support by clicking here. Also, be sure to check out the Algorithm Predicted Finishing Order for this race by clicking here!
“Low-Wear” Intermediate Track Speed Report & Loop Data Driver Averages
The charts below should look similar if you checked out my DraftKings article last weekend for Homestead. Again, we have nine races on “low-wear” intermediates that we can look at from 2020, and the chart for those is below. Those tracks include two races here at Las Vegas, two races at Charlotte, two races at Kansas, two races at Texas, and then one race at Kentucky.
Also included is a chart for the last two years of Las Vegas races. I combined the last two years because that is the time frame of NASCAR using this package. Most drivers have four Las Vegas starts over that time frame. The following statistics are included in these charts. You can click on column headers to sort by that column.
- Starts
- Finish
- ARP = average running position
- DR = driver rating
- FL = fastest laps (total)
- LL = laps led (total)
- T15 = laps ran inside top 15 (total)
- Total Laps = laps completed (total)
2020 Driver Averages on Low-Wear Intermediate Tracks
| Brad Keselowski | 9 | 06.4 | 10.2 | 97.3 | 110 | 108 | 2025 | 2617 |
| Kevin Harvick | 9 | 07.2 | 09.2 | 106.9 | 186 | 328 | 2141 | 2616 |
| Ryan Blaney | 9 | 07.7 | 06.2 | 114.2 | 236 | 225 | 2433 | 2616 |
| Kyle Larson | 1 | 09.0 | 09.9 | 95.9 | 5 | 0 | 249 | 267 |
| Martin Truex Jr | 9 | 09.4 | 08.3 | 105.9 | 208 | 257 | 2170 | 2603 |
| Kyle Busch | 9 | 10.8 | 10.9 | 96.1 | 127 | 172 | 2012 | 2616 |
| Joey Logano | 9 | 11.0 | 08.8 | 105.6 | 68 | 219 | 2133 | 2526 |
| Kurt Busch | 9 | 11.8 | 11.9 | 91.4 | 77 | 85 | 2040 | 2546 |
| Denny Hamlin | 9 | 12.1 | 15.1 | 90.2 | 144 | 247 | 1534 | 2609 |
| Matt DiBenedetto | 9 | 12.6 | 12.5 | 88.2 | 22 | 40 | 1824 | 2525 |
| Austin Dillon | 9 | 13.6 | 12.8 | 84.6 | 20 | 23 | 1892 | 2594 |
| Chase Elliott | 9 | 13.9 | 08.8 | 103.6 | 226 | 257 | 2095 | 2615 |
| Alex Bowman | 9 | 14.9 | 08.7 | 100.2 | 178 | 269 | 2207 | 2600 |
| Aric Almirola | 9 | 14.9 | 14.7 | 84.6 | 90 | 164 | 1475 | 2615 |
| Cole Custer | 9 | 15.7 | 18.8 | 72.0 | 21 | 5 | 837 | 2502 |
| Erik Jones | 9 | 15.9 | 14.5 | 80.4 | 63 | 9 | 1451 | 2615 |
| Tyler Reddick | 9 | 16.0 | 15.5 | 75.8 | 43 | 5 | 1460 | 2505 |
| Christopher Bell | 9 | 16.9 | 17.8 | 72.2 | 42 | 5 | 939 | 2601 |
| William Byron | 9 | 17.7 | 12.6 | 85.5 | 86 | 57 | 1834 | 2534 |
| Ryan Newman | 8 | 19.9 | 20.5 | 62.0 | 11 | 1 | 471 | 2328 |
| Chris Buescher | 9 | 20.3 | 21.1 | 65.1 | 22 | 10 | 537 | 2507 |
| Ricky Stenhouse Jr | 9 | 21.1 | 20.6 | 68.1 | 20 | 31 | 581 | 2289 |
| Corey LaJoie | 9 | 22.1 | 24.8 | 52.0 | 8 | 1 | 162 | 2607 |
| Michael McDowell | 9 | 22.3 | 23.7 | 55.2 | 5 | 1 | 254 | 2591 |
| Ty Dillon | 9 | 22.6 | 24.7 | 53.7 | 3 | 0 | 155 | 2537 |
| Ross Chastain | 2 | 24.5 | 20.1 | 64.2 | 8 | 0 | 149 | 668 |
| Daniel Suarez | 9 | 26.3 | 28.7 | 44.4 | 4 | 0 | 20 | 2590 |
| Bubba Wallace | 9 | 27.1 | 23.9 | 55.1 | 4 | 0 | 290 | 1957 |
| Ryan Preece | 9 | 29.1 | 24.2 | 52.8 | 1 | 1 | 85 | 2252 |
| Josh Bilicki | 7 | 32.0 | 34.4 | 33.0 | 9 | 0 | 3 | 1842 |
| James Davison | 1 | 32.0 | 34.5 | 34.2 | 0 | 0 | 0 | 258 |
| Quin Houff | 9 | 32.6 | 33.9 | 34.1 | 2 | 0 | 1 | 2496 |
| Joey Gase | 9 | 34.6 | 36.1 | 28.8 | 4 | 0 | 1 | 2145 |
| BJ McLeod | 4 | 35.0 | 34.7 | 30.7 | 1 | 0 | 8 | 980 |
| Timmy Hill | 9 | 35.3 | 35.5 | 29.4 | 14 | 0 | 5 | 2051 |
2019-2020 Driver Averages At Las Vegas
| Kevin Harvick | 4 | 06.0 | 04.9 | 121.2 | 113 | 227 | 1034 | 1069 |
| Joey Logano | 4 | 06.3 | 08.3 | 120.4 | 88 | 246 | 847 | 1069 |
| Brad Keselowski | 4 | 06.3 | 11.5 | 93.5 | 39 | 19 | 747 | 1069 |
| Martin Truex Jr | 4 | 08.3 | 08.5 | 106.4 | 83 | 33 | 907 | 1069 |
| Alex Bowman | 4 | 08.8 | 09.9 | 96.8 | 46 | 5 | 923 | 1069 |
| Kyle Larson | 3 | 09.7 | 13.0 | 91.9 | 21 | 2 | 543 | 801 |
| Kyle Busch | 4 | 10.8 | 13.7 | 93.1 | 43 | 19 | 691 | 1068 |
| Denny Hamlin | 4 | 11.3 | 10.9 | 98.0 | 64 | 124 | 804 | 1069 |
| Ryan Blaney | 4 | 11.3 | 11.1 | 97.3 | 64 | 21 | 792 | 1068 |
| Matt DiBenedetto | 4 | 11.5 | 15.6 | 78.2 | 9 | 17 | 432 | 1067 |
| Aric Almirola | 4 | 14.5 | 12.5 | 86.1 | 17 | 3 | 784 | 1069 |
| Ricky Stenhouse Jr | 4 | 14.5 | 16.5 | 78.0 | 20 | 35 | 442 | 1067 |
| Chris Buescher | 4 | 14.8 | 18.4 | 68.0 | 4 | 11 | 211 | 1068 |
| Chase Elliott | 4 | 15.3 | 07.0 | 108.5 | 142 | 155 | 986 | 1068 |
| Ryan Newman | 3 | 16.3 | 19.2 | 64.2 | 3 | 0 | 241 | 800 |
| Austin Dillon | 4 | 17.0 | 14.0 | 81.8 | 18 | 3 | 692 | 1061 |
| William Byron | 4 | 17.5 | 10.8 | 88.7 | 56 | 39 | 845 | 1069 |
| Kurt Busch | 4 | 17.5 | 14.2 | 89.0 | 26 | 52 | 693 | 988 |
| Cole Custer | 2 | 17.5 | 21.6 | 61.5 | 5 | 0 | 70 | 535 |
| Erik Jones | 4 | 20.0 | 19.9 | 70.8 | 20 | 0 | 412 | 1056 |
| Ty Dillon | 4 | 20.3 | 23.3 | 54.6 | 10 | 0 | 111 | 1065 |
| Bubba Wallace | 4 | 20.8 | 23.7 | 54.9 | 3 | 0 | 37 | 1064 |
| Daniel Suarez | 4 | 24.0 | 21.9 | 57.4 | 12 | 41 | 376 | 1061 |
| Corey LaJoie | 4 | 24.5 | 25.8 | 47.8 | 3 | 0 | 84 | 1063 |
| Ryan Preece | 4 | 27.0 | 25.3 | 48.6 | 1 | 0 | 15 | 1020 |
| Michael McDowell | 4 | 27.8 | 25.3 | 51.7 | 1 | 16 | 110 | 1042 |
| Tyler Reddick | 2 | 28.0 | 22.3 | 56.2 | 3 | 0 | 125 | 424 |
| Christopher Bell | 2 | 28.5 | 22.3 | 55.2 | 3 | 0 | 83 | 525 |
| Ross Chastain | 3 | 30.3 | 26.7 | 47.2 | 5 | 0 | 152 | 786 |
| Quin Houff | 2 | 33.0 | 33.8 | 33.0 | 0 | 0 | 0 | 517 |
| BJ McLeod | 2 | 35.0 | 35.0 | 29.3 | 0 | 0 | 0 | 479 |
| Garrett Smithley | 2 | 35.0 | 36.0 | 28.7 | 0 | 0 | 0 | 507 |
| Joey Gase | 4 | 35.5 | 35.9 | 27.4 | 0 | 0 | 0 | 773 |
| Josh Bilicki | 1 | 36.0 | 36.4 | 27.5 | 2 | 0 | 0 | 227 |
| Timmy Hill | 2 | 37.5 | 37.0 | 26.1 | 5 | 0 | 0 | 335 |
DraftKings Strategy for Las Vegas
Optimal lineup construction on Sunday is going to come down to how many drivers dominate and for how long. Last fall, we had two dominators: Denny Hamlin and Chase Elliott, while in the spring there were three drivers with 50+ laps led: Kevin Harvick, Chase Elliott, and Joey Logano. Fall of 2019 saw Logano lead for 105 laps with Harvick (47 laps led) and Truex (32 laps led) being semi-dominators, and the spring of 2019 we basically had Harvick and Logano as the dominators (88 and 86 laps led, respectively).
- There are 267 laps scheduled for the Pennzoil 400 on Sunday which means there are 66.75 DraftKings FPTS up for grabs for those laps led. Additionally, you can expect right around 210 to 220 green flag laps, giving us an additional 96.75 (approximately) DraftKings FPTS up for grabs for fastest laps.
- Last year’s spring race saw three drivers (Chase Elliott, William Byron, and Kevin Harvick) grab 30+ fastest laps each, while the fall race we had just two (Denny Hamlin and Chase Elliott) rack up 50+ each. Alex Bowman had 18 and 20 fastest laps in those races (each).
- Goodyear is bringing the same tire combination that was used in the Playoff races here at Las Vegas and at Texas last year. The specific left- and right-side tires were also used in a few other events (see my tweet below). One thing to note with the Playoff races here at Vegas and Texas is that the Vegas race was a night race and Texas was that crazy one that was delayed by rain and then moved to Wednesday.
Now for the video breakdown! Be sure to go here and subscribe to my YouTube channel if you haven’t already.
GPP / Tournament Picks
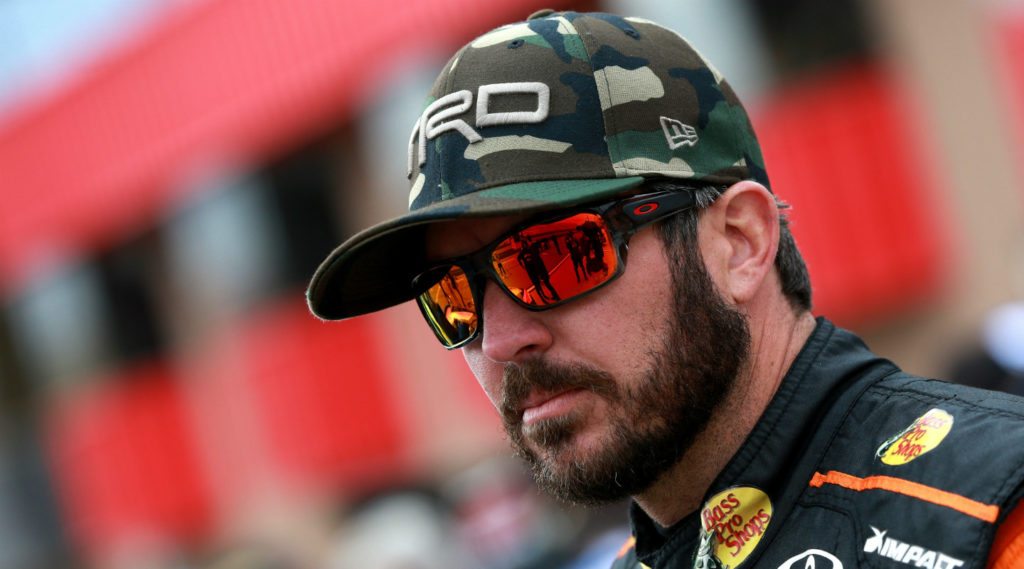
Martin Truex, Jr. ($11,100) – The $9,000-$11,000 range this week is packed with great options, so it’s very possible that Martin Truex, Jr. gets overlooked this week–just like he did at Homestead (at only 9.2% ownership!?). And while I’m kind of down on Joe Gibbs Racing as a whole this week at Las Vegas, Martin Truex, Jr. is usually the exception with that because this team is a lot more consistent on speed than the others. Here at Vegas, Truex is a two-time winner and consistent front runner. He has never finished outside of the top 10 in the Stages at this track and has top 5s in five of the last seven races. Additionally, MTJ has the 4th-most fastest laps (83) at Vegas under this rules package, and had the 3rd-most fastest laps on “low-wear” tracks last season. Don’t sleep on Truex. I obviously like Harvick and Chase Elliott more as dominators on Sunday but Truex is right there with those two in “ceiling” projections.
Alex Bowman ($8,800) – At this point, I might as well apply to become the leader of the Alex Bowman fan club. I was on him for most 1.5-mile track races last season and once again this year I’m sticking to it. Bowman doesn’t have the place differential upside like the chalk drivers priced around him (Matt DiBenedetto ($9,000) and Aric Almirola ($8,600)) but the #48 Chevrolet has dominator potential. Bowman had the 5th-most fastest laps on “low-wear” tracks last season and also led the 2nd-most laps (269–nice). Here at Vegas, AB has the 5th-best average running position (9.9) over the last four races and the 5th-best average finish as well (8.8). You know how I like about getting off of chalk in tournaments… here’s your guy.
Cole Custer ($6,500) – My projections LOVE Cole Custer. Almost to the point where an optimizer would consider him a cash game play. And maybe that will end up being the case, I don’t know for sure. But with Chris Buescher ($6,400) likely getting an ownership bump thanks to his performance at Homestead last weekend, and Anthony Alfredo ($5,600) looking like a great cheap play option down there, I could easily see Custer being overlooked. During his rookie year last season, Cole had an average finish of 15.7 on the “low-wear” intermediate tracks which is right around where my projections have him finishing as well. A $6,500 driver with top 10 upside is a great tournament option on any slate.
Cash Core Drivers
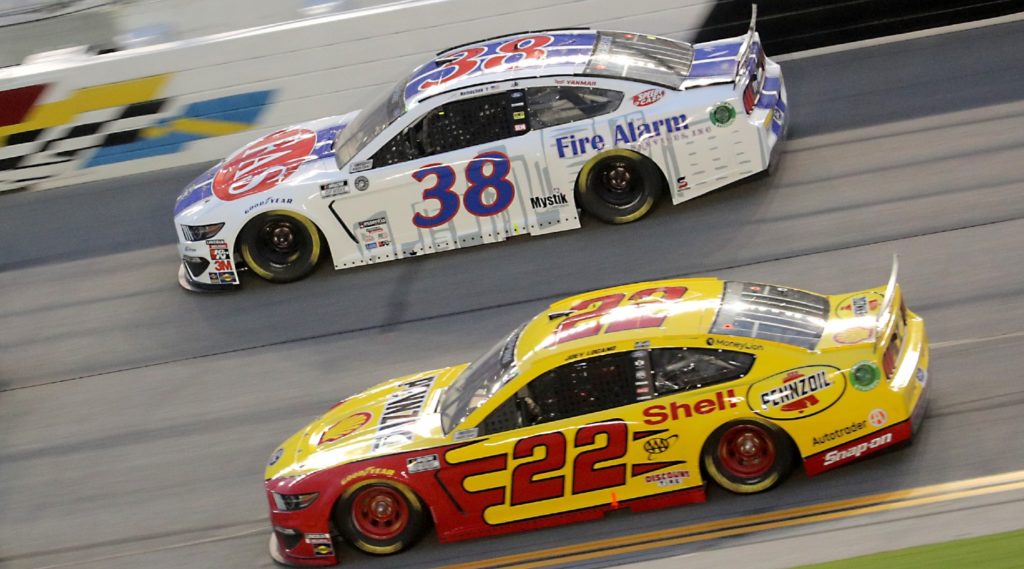
Joey Logano ($10,000) – DraftKings mis-priced Joey Logano this weekend. This guy has won the last two spring races here at Las Vegas and has finished top 5 in five of the last eight. He also has only one finish worse than 8th over that same span. Additionally, under this rules package at Las Vegas (so the last four races), Logano has led the most laps (246) while posting the 2nd-best average finish (6.3). The #22 Ford will start from back in 15th when the Pennzoil 400 goes green on Sunday and could easily get to the lead at some point by the end of this thing. Logano was tied for the 4th-best average running position on “low-wear” intermediates last season.
Kevin Harvick ($9,700) – I talked about Kevin Harvick quite a bit in my video above, so make sure you check that out. But I can’t see not taking Harvick in cash at this price. I understand the strategy in going underweight on him in tournaments, but this is still Kevin Harvick at $9,700. Yes, he’s a risk because he’s on the pole, but Harv had the 2nd-best average finish (7.2) on “low-wear” tracks last season while leading the most laps (328) and having the 4th-most fastest laps (186). Over the last four races here at Vegas, Harvick has the best average finish (6.0), the 2nd-most fastest laps (113), and the 2nd-most fastest laps (227). Don’t over-think this one. Harvick is a great cash game play.
Anthony Alfredo ($5,600) – Last week at Homestead-Miami, Anthony Alfredo passed his first real test of his rookie Cup Series season, and he survived. That’s really all we can ask out of him right now. Now we’re at an “easier” track in Las Vegas Motor Speedway and he’s driving the same car that finished 24th and 20th in the two Vegas races last season. Alfredo starts 27th and is priced at $5,600… yup, cash play. If he can keep this car clean, I think Anthony has top 20 upside which might end up putting him into the optimal lineup overall on this slate as well depending on how dominators play out.
Las Vegas Pennzoil 400 DraftKings Driver Projections
The following chart takes into account the very basics: the starting position and the projected finish of each driver. The projected finishes are averaged from six different ranking systems. Also factored in are projected laps led and fastest laps for each driver. You can click the headers below to sort the chart by that attribute. By default it is sorted by average projected FPTS.
| Driver | DraftKings Salary | Avg Proj FPTS | Starting Position | Ceiling Proj FPTS | Avg. Projected Finish | Dollar Per FPT |
|---|---|---|---|---|---|---|
| Kevin Harvick | $9,700 | 71.30 | 1 | 118.50 | 03.0 | $136 |
| Chase Elliott | $10,600 | 67.02 | 8 | 100.10 | 04.3 | $158 |
| Joey Logano | $10,000 | 62.05 | 15 | 87.75 | 04.8 | $161 |
| Martin Truex Jr | $11,100 | 61.48 | 4 | 99.95 | 03.3 | $181 |
| Ryan Blaney | $10,800 | 58.78 | 26 | 83.25 | 07.5 | $184 |
| Alex Bowman | $8,800 | 54.05 | 9 | 79.00 | 06.8 | $163 |
| Denny Hamlin | $9,200 | 49.53 | 6 | 79.25 | 06.8 | $186 |
| Kyle Larson | $9,400 | 48.38 | 3 | 82.50 | 06.7 | $194 |
| Kyle Busch | $11,400 | 45.67 | 14 | 62.00 | 08.3 | $250 |
| Brad Keselowski | $10,300 | 45.18 | 10 | 67.10 | 07.0 | $228 |
| Aric Almirola | $8,600 | 44.97 | 28 | 55.60 | 13.5 | $191 |
| Matt DiBenedetto | $9,000 | 44.12 | 30 | 55.35 | 15.3 | $204 |
| Cole Custer | $6,500 | 36.85 | 20 | 52.25 | 14.8 | $176 |
| Erik Jones | $7,100 | 35.83 | 29 | 46.90 | 19.0 | $198 |
| Kurt Busch | $8,100 | 35.20 | 7 | 56.25 | 10.0 | $230 |
| William Byron | $8,300 | 34.40 | 2 | 69.20 | 10.7 | $241 |
| Austin Dillon | $7,600 | 33.57 | 12 | 43.60 | 11.8 | $226 |
| Ricky Stenhouse Jr | $6,800 | 31.30 | 17 | 53.70 | 16.2 | $217 |
| Christopher Bell | $7,700 | 30.07 | 16 | 48.50 | 15.3 | $256 |
| Chase Briscoe | $7,400 | 29.07 | 24 | 40.80 | 19.8 | $255 |
| Ross Chastain | $7,300 | 28.73 | 21 | 44.50 | 19.0 | $254 |
| Chris Buescher | $6,400 | 26.12 | 18 | 43.35 | 18.7 | $245 |
| Tyler Reddick | $7,900 | 25.92 | 11 | 45.95 | 16.0 | $305 |
| Bubba Wallace | $7,000 | 22.17 | 23 | 36.00 | 22.0 | $316 |
| Anthony Alfredo | $5,600 | 20.17 | 27 | 30.00 | 25.3 | $278 |
| Ryan Newman | $6,700 | 19.67 | 13 | 28.90 | 18.7 | $341 |
| Daniel Suarez | $6,100 | 18.50 | 22 | 31.00 | 23.7 | $330 |
| Corey Lajoie | $6,300 | 18.00 | 33 | 29.00 | 28.3 | $350 |
| Ryan Preece | $5,800 | 16.00 | 19 | 24.00 | 23.5 | $363 |
| Justin Haley | $5,400 | 14.50 | 25 | 21.00 | 26.8 | $372 |
| Joey Gase | $4,600 | 08.83 | 37 | 16.00 | 34.0 | $521 |
| Michael McDowell | $6,000 | 08.33 | 5 | 24.00 | 20.5 | $720 |
| Josh Bilicki | $4,800 | 08.33 | 35 | 10.00 | 34.0 | $576 |
| Quin Houff | $5,300 | 07.67 | 36 | 13.00 | 34.2 | $691 |
| Cody Ware | $4,500 | 07.33 | 32 | 14.00 | 33.2 | $614 |
| Timmy Hill | $5,000 | 07.00 | 38 | 09.00 | 36.2 | $714 |
| Garrett Smithley | $4,700 | 06.50 | 31 | 10.00 | 32.8 | $723 |
| BJ McLeod | $5,100 | 06.33 | 34 | 09.00 | 34.2 | $805 |


