We’re staying in Florida for one more race but it is yet another different track type to start out the season, as the Cup Series is at Homestead-Miami Speedway on Sunday for the Dixie Vodka 400. This is our first intermediate track race of the season and tires are going to play a huge role in this race. The drivers that are able to maintain their tires through the course of a run will be the fastest at the end, and pit crews are going to have more pressure on Sunday because these drivers will be wanting tires with every single caution.
NOTE: Alex Bowman will drop to the rear on the pace laps but will still be scored from 13th. There is no change in projections or thoughts to how he will race.
NOTE 2: Deny Hamlin also failed inspection. Would recommend significantly lowering exposure. Logano and Bell will be on the front row now.
If you didn’t read my Fantasy/Betting Preview for this race, I’d recommend doing so by clicking here. Also, I’d recommend checking out my FanDuel post this week as well, as there is quite a bit of crossover in drivers that I like. You can check that out by clicking here. Denny Hamlin is on the pole for the sixth time in the last seven Homestead Races and you can see the full starting lineup by clicking here. Now let’s gooooo!!!!
Enjoy the FREE content on this site? Consider buying me a beer by donating here. Miller Lite is my favorite. Also, if you missed the Algorithm Predicted Finishing Order for this race, click here to check it out!
Intermediate Track Speed Report & Loop Data Driver Averages
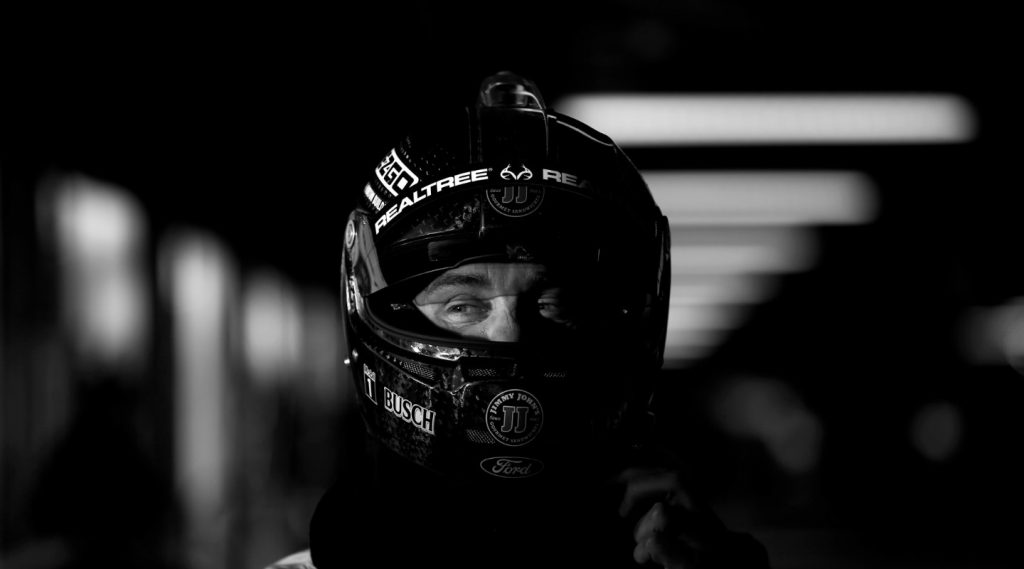
We don’t have any 2021 speed data to go off of for this race since it’s the first intermediate track that the Cup Series is visiting, but we do have 2020 data to look at. So below you will find a couple of charts that include statistics for most drivers. These charts are broken into two main categories: “high-wear” and “low-wear.” Last season, the Cup Series ran six races on “high-wear” tracks, which include one here at Homestead, one at Auto Club, one at Atlanta, and then three races at Darlington.
Then we have “low-wear” tracks. This data doesn’t translate as well to Homestead as the “high-wear” data, but it’s still worth looking at, in my opinion. The low wear races during 2020 included: Charlotte (twice), Kansas (twice), Kentucky, Las Vegas (twice), and Texas (twice). One major differentiating factor between “low-wear” and “high-wear” tracks is the fact that teams can gamble on tires with “low-wear” tracks. You can’t do that here at Homestead or the other “high-wear” venues.
The following statistics are included in these charts. You can click on column headers to sort by that column.
- Starts
- Finish
- ARP = average running position
- DR = driver rating
- FL = fastest laps (total)
- LL = laps led (total)
- T15 = laps ran inside top 15 (total)
- Total Laps = laps completed (total)
2020 Driver Averages on High-Wear Intermediate Tracks
| Denny Hamlin | 6 | 05.2 | 6.10 | 111.1 | 94 | 168 | 1565 | 1660 |
| Kevin Harvick | 6 | 06.8 | 7.22 | 112.8 | 148 | 352 | 1479 | 1659 |
| Kyle Busch | 6 | 07.5 | 9.89 | 97.9 | 64 | 9 | 1334 | 1659 |
| Brad Keselowski | 6 | 08.7 | 11.01 | 95.7 | 71 | 99 | 1306 | 1660 |
| Kurt Busch | 6 | 08.7 | 11.86 | 90.9 | 57 | 6 | 1233 | 1659 |
| Alex Bowman | 6 | 09.5 | 7.36 | 108.9 | 144 | 152 | 1526 | 1658 |
| Aric Almirola | 6 | 09.7 | 12.08 | 91.1 | 19 | 0 | 1165 | 1659 |
| Martin Truex Jr | 6 | 11.2 | 7.21 | 107.0 | 176 | 280 | 1480 | 1659 |
| Tyler Reddick | 6 | 12.3 | 14.06 | 83.5 | 69 | 3 | 931 | 1658 |
| Austin Dillon | 6 | 12.5 | 16.23 | 76.2 | 14 | 0 | 669 | 1658 |
| Chase Elliott | 6 | 12.7 | 6.61 | 107.1 | 104 | 195 | 1598 | 1652 |
| Erik Jones | 6 | 12.7 | 12.33 | 91.0 | 66 | 27 | 1288 | 1656 |
| Joey Logano | 6 | 12.7 | 12.83 | 86.4 | 43 | 56 | 1150 | 1658 |
| Ryan Blaney | 6 | 14.5 | 12.85 | 93.9 | 98 | 126 | 991 | 1658 |
| Matt DiBenedetto | 6 | 16.0 | 15.84 | 77.2 | 9 | 0 | 865 | 1658 |
| Ryan Newman | 5 | 17.6 | 19.02 | 69.8 | 15 | 5 | 378 | 1455 |
| William Byron | 6 | 18.2 | 18.23 | 78.9 | 12 | 4 | 887 | 1634 |
| Ricky Stenhouse Jr | 5 | 19.4 | 20.15 | 62.6 | 11 | 6 | 402 | 1363 |
| Michael McDowell | 6 | 19.5 | 22.90 | 60.2 | 5 | 0 | 72 | 1658 |
| Cole Custer | 6 | 20.7 | 20.70 | 63.0 | 5 | 0 | 225 | 1655 |
| Kyle Larson | 1 | 21.0 | 23.30 | 66.4 | 1 | 0 | 32 | 199 |
| Christopher Bell | 6 | 22.2 | 20.56 | 62.6 | 15 | 0 | 338 | 1521 |
| Bubba Wallace | 6 | 22.7 | 21.95 | 60.3 | 3 | 3 | 205 | 1507 |
| Ross Chastain | 2 | 23.0 | 27.56 | 51.7 | 1 | 0 | 43 | 560 |
| Chris Buescher | 6 | 23.7 | 21.78 | 59.8 | 18 | 0 | 194 | 1649 |
| Ty Dillon | 6 | 24.7 | 24.40 | 51.9 | 2 | 8 | 82 | 1650 |
| Ryan Preece | 6 | 26.0 | 22.93 | 58.3 | 7 | 0 | 214 | 1515 |
| Daniel Suarez | 6 | 27.8 | 28.82 | 42.9 | 2 | 1 | 15 | 1640 |
| Corey LaJoie | 6 | 29.5 | 28.05 | 45.2 | 2 | 0 | 19 | 1514 |
| Quin Houff | 6 | 32.2 | 33.64 | 33.0 | 0 | 0 | 2 | 1466 |
| Joey Gase | 6 | 33.2 | 34.96 | 31.4 | 4 | 0 | 0 | 1603 |
| Josh Bilicki | 4 | 34.3 | 34.58 | 32.2 | 2 | 0 | 0 | 1200 |
| Timmy Hill | 6 | 35.2 | 36.18 | 29.2 | 11 | 0 | 2 | 1486 |
| BJ McLeod | 4 | 37.5 | 36.76 | 25.6 | 1 | 0 | 3 | 474 |
| James Davison | 1 | 39.0 | 37.60 | 25.3 | 0 | 0 | 0 | 162 |
2020 Driver Averages on Low-Wear Intermediate Tracks
| Brad Keselowski | 9 | 06.4 | 10.2 | 97.3 | 110 | 108 | 2025 | 2617 |
| Kevin Harvick | 9 | 07.2 | 09.2 | 106.9 | 186 | 328 | 2141 | 2616 |
| Ryan Blaney | 9 | 07.7 | 06.2 | 114.2 | 236 | 225 | 2433 | 2616 |
| Kyle Larson | 1 | 09.0 | 09.9 | 95.9 | 5 | 0 | 249 | 267 |
| Martin Truex Jr | 9 | 09.4 | 08.3 | 105.9 | 208 | 257 | 2170 | 2603 |
| Kyle Busch | 9 | 10.8 | 10.9 | 96.1 | 127 | 172 | 2012 | 2616 |
| Joey Logano | 9 | 11.0 | 08.8 | 105.6 | 68 | 219 | 2133 | 2526 |
| Kurt Busch | 9 | 11.8 | 11.9 | 91.4 | 77 | 85 | 2040 | 2546 |
| Denny Hamlin | 9 | 12.1 | 15.1 | 90.2 | 144 | 247 | 1534 | 2609 |
| Matt DiBenedetto | 9 | 12.6 | 12.5 | 88.2 | 22 | 40 | 1824 | 2525 |
| Austin Dillon | 9 | 13.6 | 12.8 | 84.6 | 20 | 23 | 1892 | 2594 |
| Chase Elliott | 9 | 13.9 | 08.8 | 103.6 | 226 | 257 | 2095 | 2615 |
| Alex Bowman | 9 | 14.9 | 08.7 | 100.2 | 178 | 269 | 2207 | 2600 |
| Aric Almirola | 9 | 14.9 | 14.7 | 84.6 | 90 | 164 | 1475 | 2615 |
| Cole Custer | 9 | 15.7 | 18.8 | 72.0 | 21 | 5 | 837 | 2502 |
| Erik Jones | 9 | 15.9 | 14.5 | 80.4 | 63 | 9 | 1451 | 2615 |
| Tyler Reddick | 9 | 16.0 | 15.5 | 75.8 | 43 | 5 | 1460 | 2505 |
| Christopher Bell | 9 | 16.9 | 17.8 | 72.2 | 42 | 5 | 939 | 2601 |
| William Byron | 9 | 17.7 | 12.6 | 85.5 | 86 | 57 | 1834 | 2534 |
| Ryan Newman | 8 | 19.9 | 20.5 | 62.0 | 11 | 1 | 471 | 2328 |
| Chris Buescher | 9 | 20.3 | 21.1 | 65.1 | 22 | 10 | 537 | 2507 |
| Ricky Stenhouse Jr | 9 | 21.1 | 20.6 | 68.1 | 20 | 31 | 581 | 2289 |
| Corey LaJoie | 9 | 22.1 | 24.8 | 52.0 | 8 | 1 | 162 | 2607 |
| Michael McDowell | 9 | 22.3 | 23.7 | 55.2 | 5 | 1 | 254 | 2591 |
| Ty Dillon | 9 | 22.6 | 24.7 | 53.7 | 3 | 0 | 155 | 2537 |
| Ross Chastain | 2 | 24.5 | 20.1 | 64.2 | 8 | 0 | 149 | 668 |
| Daniel Suarez | 9 | 26.3 | 28.7 | 44.4 | 4 | 0 | 20 | 2590 |
| Bubba Wallace | 9 | 27.1 | 23.9 | 55.1 | 4 | 0 | 290 | 1957 |
| Ryan Preece | 9 | 29.1 | 24.2 | 52.8 | 1 | 1 | 85 | 2252 |
| Josh Bilicki | 7 | 32.0 | 34.4 | 33.0 | 9 | 0 | 3 | 1842 |
| James Davison | 1 | 32.0 | 34.5 | 34.2 | 0 | 0 | 0 | 258 |
| Quin Houff | 9 | 32.6 | 33.9 | 34.1 | 2 | 0 | 1 | 2496 |
| Joey Gase | 9 | 34.6 | 36.1 | 28.8 | 4 | 0 | 1 | 2145 |
| BJ McLeod | 4 | 35.0 | 34.7 | 30.7 | 1 | 0 | 8 | 980 |
| Timmy Hill | 9 | 35.3 | 35.5 | 29.4 | 14 | 0 | 5 | 2051 |
DraftKings Strategy for Homestead-Miami
Finally we get to take dominator points into account for a race! This weekend’s Dixie Vodka 400 at Homestead-Miami Speedway is scheduled to run for 267 laps, which is basically the total amount of laps we’ve had through the first two races combined. What that means is, we now must have a focus on laps led and fastest lap dominator points in addition to place differential. Yes, there are still several big place differential drive plays on this slate, but the top lineup on Sunday will likely be a combination of both dominators and high finishers/place differential.
- The last five races at Homestead have all had at least 5 drivers post 19 or more fastest laps in the race. The average “top dog” in fastest laps grabs about 20% of the share; last year it was Tyler Reddick with 48 fastest laps (20.8%); in 2019 it was Martin Truex, Jr. with 61 fastest laps (24.9%); in 2018 it was Kyle Larson with 51 fastest laps (22.2%).
- With laps led, we typically have at least two main dominators. Last year, Denny Hamlin led 137 laps from the pole while Ryan Blaney led 70 laps. In 2019, Kyle Busch led 120 laps while Martin Truex, Jr. led 103. And in 2018, we actually had four drivers–Joey Logano, Kevin Harvick, Kyle Larson, and Denny Hamlin–lead 40+ each, with Logano leading the most with 80.
Now for the video breakdown! Be sure to go here and subscribe to my YouTube channel if you haven’t already.
NOTE: In the video, I said there is no competition caution. That was what was stated before I made the video, but soon after it was announced there WILL be a competition caution, so ignore that.
GPP / Tournament Picks
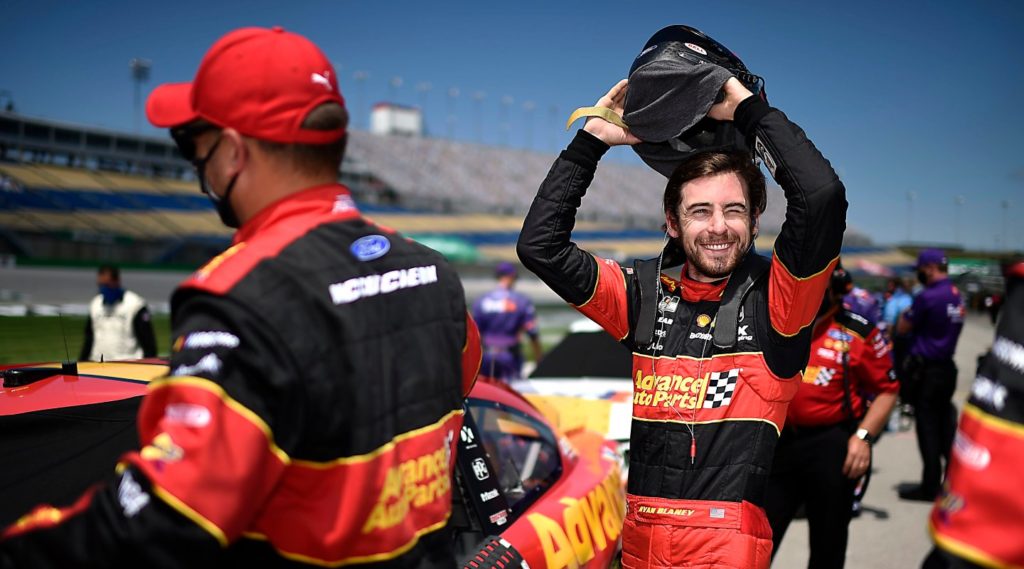
Ryan Blaney ($10,400) – The $10,000+ driver price range is where you will end up being profitable or not on Sunday, in my opinion. And one guy I think is going to be over-looked in this price range is Ryan Blaney. The top-priced drivers on this slate–Kyle Busch ($11,800), Martin Truex, Jr. ($11,400), Chase Elliott ($11,000), Kyle Larson ($10,700), and under-priced Kevin Harvick ($10,100)–all have histories here at Homestead-Miami Speedway, and could all easily contend for the win. But don’t forget about Blaney, the same guy who was the best on 1.5-mile tracks last season. On “high-wear” tracks specifically, Blaney’s 2020 numbers aren’t eye-popping, but don’t forget that he’s not very good at Darlington, and three of the six “high-wear” races were on that track. Here at Homestead, Blaney had 27 fastest laps and led 70 laps. At Atlanta, Blaney finished 4th. And at Auto Club, Blaney and Alex Bowman were the class of the field all day, but Blaney had to pit late with a tire issue. The #12 Ford rolls off the grid from 14th on Sunday, which gives Ryan some place differential potential as well.
Alex Bowman ($8,300) – Not only do I love Bowman as a pivot off of the Tyler Reddick ($8,500) chalk, but I don’t mind throwing them both into the same lineup as well. Alex Bowman is massively under-priced here in DraftKings, assuming he’s going to have the same speed as he did in 2020. Last year, Alex had the 5th-best average running position on “high-wear” tracks and the 3rd-most fastest laps. On “low-wear” intermediates, he ranked 3rd- and 5th-best in those categories, respectively. Here at Homestead, Bowman had a top 10 car last year but had to make a late, unexpected pit stop. He finished 9th here in the 2019 race.
Daniel Suarez ($5,700) – The chalk down in this price range is going to be Anthony Alfredo ($5,500) and Corey LaJoie ($5,400). Alfredo starts back in 27th and, as long as he doesn’t wreck, should move up a few spots. LaJoie supposedly has a stronger car than last year, and even though he starts 25th, a finish of 23rd or better will make him a great value at his salary. But the same applies to Daniel Suarez: supposedly he’s in the best car of his career. I personally don’t believe that, but I’d be lying if I said the #99 Chevrolet wasn’t stronger than I expected the first two weeks. If Suarez can crack the top 20 on Sunday, he could end up being in the optimal lineup.
BONUS: Austin Dillon ($7,700) – I actually like Austin Dillon on both DraftKings and FanDuel this weekend. I wrote about why I like him so much in my FanDuel article, which you can read by clicking here.
BONUS #2 in case another jackass comes at me on Twitter saying I’m not on him like last week: Christopher Bell ($7,600) – Watch the video to learn why.
Cash Core Drivers
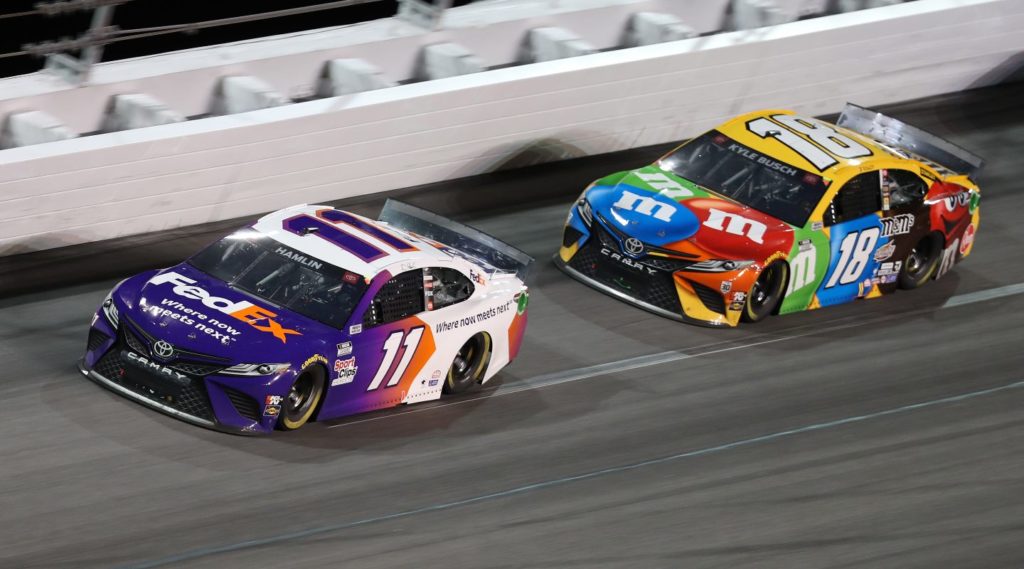
Denny Hamlin ($9,600) – DraftKings under-priced the pole sitter this weekend, which makes Denny Hamlin a cash play. For the record, I like pivoting off of him to Kevin Harvick ($10,100) or Christopher Bell ($7,600) in tournaments, but in cash games, Hamlin is likely the right choice. He won from the pole in this race last season and also had 31 fastest laps (the 2nd-most in the race). Denny also had the best average running position on “high-wear” tracks last year at 6.1, with the best average finish as well (5.2). Again, I’d go underweight on Hamlin in tournaments (watch the video to learn why) but he’s a solid cash play.
Tyler Reddick ($8,500) – Chalk, chalk, chalk. Do I even have to really talk about this? Tyler Reddick starts 35th on Sunday. He started 24th here last season and was quickly inside the top 5 and ran there the rest of the race, collecting the most fastest laps along the way. I think there’s a strategy to being underweight on Tyler Reddick in tournaments as well as fading him in Single Entry contests and qualifiers (watch the video to hear why) but in cash games, he’s a no brainer.
Chase Briscoe ($7,200) – We’re targeting place differential with the cash lineup, and I love focusing on the lower-priced place differential plays. Chase Briscoe is running probably the best equipment of the place differential plays this weekend–William Byron ($9,100) could be better but he’s also $1,900 more–and he starts 30th. We just need a mid-teens finish out of Briscoe in order for him to be a value play in cash games on Sunday. And if this guy can run a road course race with no power steering and a hood over his windshield and STILL post top 10 lap times, making laps around Homestead-Miami should be a walk in the park. For what it’s worth, in the Xfinity races here last season, Chase finished 7th and 1st.
Homestead-Miami DraftKings Driver Projections
The following chart takes into account the very basics: the starting position and the projected finish of each driver. The projected finishes are averaged from six different ranking systems. Also factored in are projected laps led and fastest laps for each driver. You can click the headers below to sort the chart by that attribute. By default it is sorted by average projected FPTS.
| Driver | DraftKings Salary | Avg Proj FPTS | Starting Position | Avg. Projected Finish | Dollar Per FPT |
|---|---|---|---|---|---|
| Martin Truex Jr | $11,400 | 69.00 | 9 | 03.2 | $165 |
| Kyle Busch | $11,800 | 67.97 | 24 | 06.0 | $174 |
| Kevin Harvick | $10,100 | 67.40 | 4 | 03.2 | $150 |
| Kyle Larson | $10,700 | 64.35 | 17 | 06.8 | $166 |
| Denny Hamlin | $9,600 | 64.07 | 1 | 04.8 | $150 |
| Chase Elliott | $11,000 | 61.37 | 11 | 03.3 | $179 |
| Tyler Reddick | $8,500 | 59.87 | 35 | 11.7 | $142 |
| Ryan Blaney | $10,400 | 51.83 | 14 | 09.7 | $201 |
| Matt DiBenedetto | $8,800 | 49.28 | 37 | 15.8 | $179 |
| Alex Bowman | $8,300 | 49.00 | 13 | 08.0 | $169 |
| William Byron | $9,100 | 46.97 | 31 | 14.3 | $194 |
| Brad Keselowski | $9,900 | 42.45 | 7 | 07.3 | $233 |
| Joey Logano | $9,300 | 41.55 | 2 | 06.8 | $224 |
| Austin Dillon | $7,700 | 38.78 | 22 | 13.2 | $199 |
| Chase Briscoe | $7,200 | 38.67 | 30 | 17.3 | $186 |
| Ross Chastain | $7,400 | 38.00 | 32 | 18.3 | $195 |
| Aric Almirola | $7,900 | 35.57 | 16 | 12.7 | $222 |
| Christopher Bell | $7,600 | 32.68 | 3 | 11.0 | $233 |
| Kurt Busch | $8,100 | 29.60 | 5 | 10.8 | $274 |
| Bubba Wallace | $7,000 | 26.67 | 19 | 17.3 | $263 |
| Daniel Suarez | $5,700 | 21.83 | 21 | 21.2 | $261 |
| Ryan Newman | $6,400 | 21.50 | 23 | 21.7 | $298 |
| Cole Custer | $6,600 | 20.67 | 10 | 16.5 | $319 |
| Anthony Alfredo | $5,500 | 20.67 | 27 | 24.3 | $266 |
| Erik Jones | $6,900 | 19.50 | 18 | 20.5 | $354 |
| Ricky Stenhouse Jr | $6,700 | 17.50 | 15 | 19.7 | $383 |
| Corey Lajoie | $5,400 | 14.83 | 25 | 26.2 | $364 |
| Josh Bilicki | $5,000 | 14.33 | 36 | 32.0 | $349 |
| Quin Houff | $5,100 | 13.67 | 38 | 32.8 | $373 |
| Chris Buescher | $6,300 | 12.83 | 12 | 20.8 | $491 |
| Justin Haley | $5,300 | 10.83 | 20 | 25.5 | $489 |
| BJ McLeod | $4,600 | 08.00 | 34 | 33.7 | $575 |
| Cody Ware | $4,800 | 06.00 | 26 | 31.5 | $800 |
| Ryan Preece | $5,900 | 05.67 | 8 | 22.7 | $1,041 |
| Michael McDowell | $6,100 | 05.50 | 6 | 22.0 | $1,109 |
| Timmy Hill | $4,700 | 05.17 | 33 | 34.5 | $910 |
| James Davison | $4,900 | 05.00 | 29 | 33.0 | $980 |
| Garrett Smithley | $4,500 | 03.00 | 28 | 33.5 | $1,500 |


