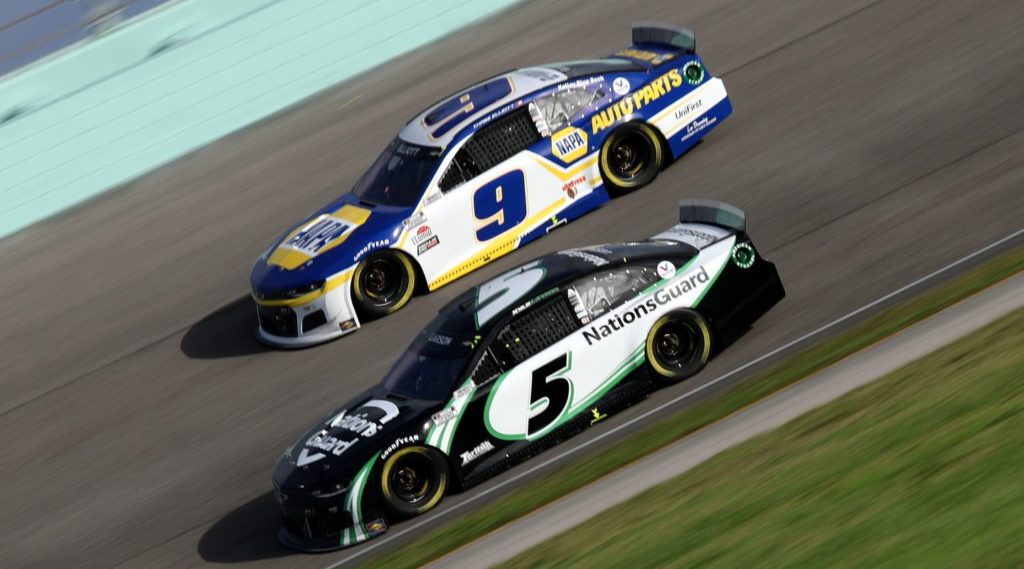
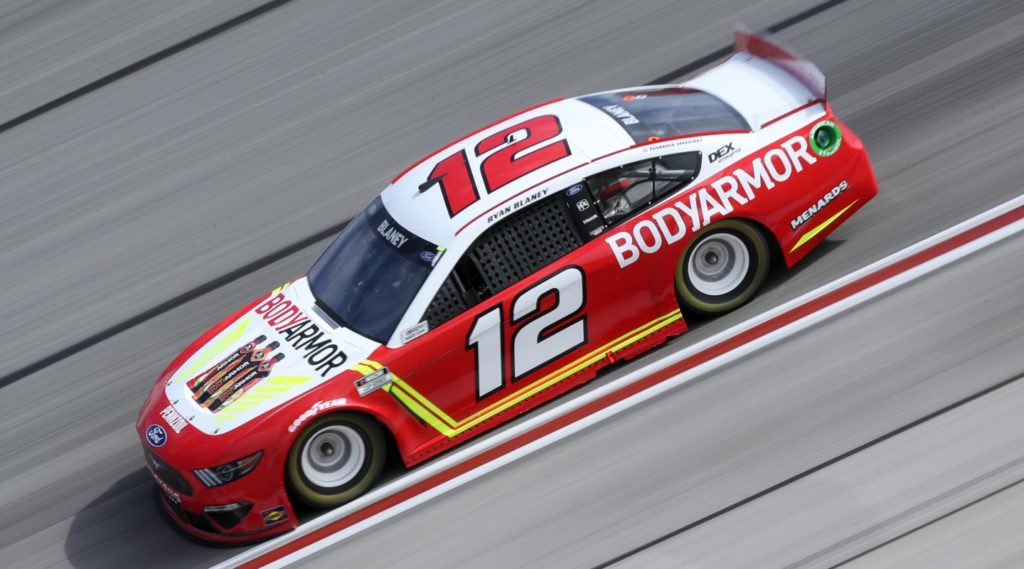
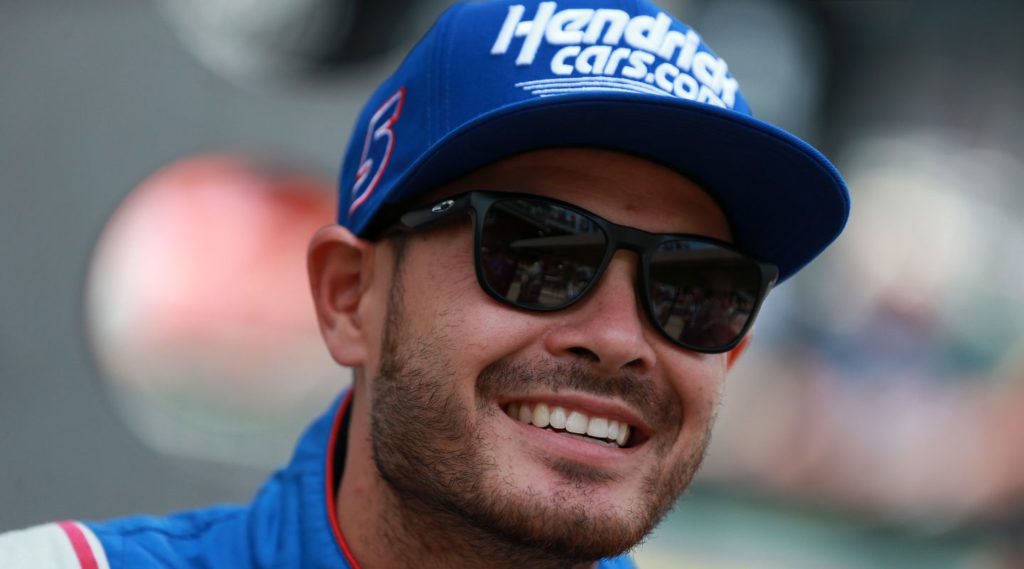
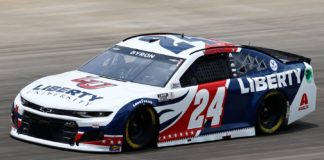
Everything is bigger in Texas, including the race this weekend, as the Autotrader EchoPark Automotive 500 kicks off the third round of the Playoffs. With 500 miles scheduled around this 1.5-mile track, that means we’re looking at a long race (334 laps), as most events at this track length are only 400 miles (except for the Coca-Cola 600 at Charlotte, of course). Kyle Larson is on the pole for Sunday’s race, and for the full starting lineup you can click here. My FanDuel article for this weekend’s race can be viewed by clicking here, and since there’s so much crossover between these two DFS sites, I always recommend checking that out. Now let’s goooo!!!!
Enjoy the FREE content that this site offers each week? Consider donating to support by clicking here.
Also, be sure to check out the Algorithm Predicted Finishing Order for this race by clicking here!
Speed Report & Loop Data Driver Averages
Just like at Las Vegas a few weeks ago, we’re focusing on “low-wear” 1.5-mile tracks this weekend. For this season, that means we’re looking back at both Vegas races, the Kansas race, and the Charlotte race. You can also look into data from the All Star Race here at Texas if you’d like. Included in the data tables below is also the 2020 data from “low wear” 1.5-mile tracks. Also included is the data from this year under the 550hp package, as we’re back to running that this weekend. Statistics included in the tables below are:
- Starts
- Finish
- ARP = average running position
- DR = driver rating
- FL = fastest laps (total)
- LL = laps led (total)
- T15 = laps ran inside top 15 (total)
- Total Laps = laps completed (total)
2021 Driver Averages At “Low Wear” 1.5-Mile Tracks
| Kyle Busch | 4 | 02.5 | 06.2 | 113.8 | 98 | 23 | 1124 | 1201 |
| Chase Elliott | 4 | 05.5 | 07.1 | 108.3 | 91 | 45 | 1080 | 1201 |
| Brad Keselowski | 4 | 05.8 | 08.8 | 104.3 | 62 | 109 | 1009 | 1201 |
| Denny Hamlin | 4 | 06.0 | 06.7 | 114.4 | 71 | 194 | 1089 | 1201 |
| Kyle Larson | 4 | 07.8 | 03.4 | 133.1 | 236 | 657 | 1156 | 1201 |
| William Byron | 4 | 09.8 | 07.2 | 106.9 | 120 | 51 | 1037 | 1200 |
| Austin Dillon | 4 | 10.3 | 12.0 | 86.7 | 30 | 8 | 939 | 1200 |
| Kevin Harvick | 4 | 10.3 | 09.9 | 93.4 | 30 | 0 | 969 | 1200 |
| Tyler Reddick | 4 | 11.0 | 10.8 | 90.5 | 56 | 18 | 947 | 1200 |
| Ryan Blaney | 4 | 11.0 | 10.3 | 98.9 | 54 | 11 | 968 | 1201 |
| Martin Truex Jr | 4 | 11.3 | 10.3 | 92.4 | 13 | 7 | 1020 | 1192 |
| Matt DiBenedetto | 4 | 12.5 | 14.5 | 81.2 | 7 | 2 | 671 | 1198 |
| Joey Logano | 4 | 13.5 | 13.1 | 80.7 | 6 | 7 | 817 | 1199 |
| Chris Buescher | 4 | 13.8 | 17.7 | 73.2 | 14 | 13 | 405 | 1199 |
| Daniel Suarez | 4 | 16.8 | 20.3 | 66.1 | 9 | 12 | 295 | 1196 |
| Michael McDowell | 4 | 17.8 | 20.6 | 60.2 | 5 | 9 | 120 | 1197 |
| Alex Bowman | 4 | 18.0 | 12.5 | 83.4 | 28 | 5 | 807 | 1197 |
| Ricky Stenhouse Jr | 4 | 18.5 | 16.3 | 71.0 | 12 | 23 | 533 | 1191 |
| Erik Jones | 4 | 19.3 | 19.2 | 67.1 | 26 | 0 | 379 | 1196 |
| Chase Briscoe | 4 | 19.5 | 22.3 | 59.7 | 2 | 0 | 159 | 1196 |
| Kurt Busch | 4 | 20.0 | 15.9 | 71.0 | 6 | 0 | 596 | 939 |
| Ryan Newman | 4 | 20.3 | 21.8 | 61.6 | 13 | 0 | 156 | 1195 |
| Christopher Bell | 4 | 20.8 | 16.1 | 76.9 | 33 | 3 | 648 | 1194 |
| Bubba Wallace | 4 | 21.0 | 20.0 | 66.8 | 13 | 0 | 484 | 1194 |
| Ross Chastain | 4 | 24.3 | 24.3 | 60.8 | 16 | 0 | 173 | 1157 |
| Cole Custer | 4 | 24.8 | 24.9 | 48.9 | 2 | 0 | 45 | 1194 |
| Anthony Alfredo | 4 | 24.8 | 24.1 | 50.7 | 2 | 4 | 78 | 1194 |
| Ryan Preece | 4 | 25.3 | 24.2 | 51.6 | 4 | 0 | 104 | 1187 |
| Aric Almirola | 4 | 27.0 | 23.9 | 53.2 | 0 | 0 | 68 | 1105 |
| Corey LaJoie | 4 | 28.3 | 25.6 | 46.8 | 1 | 0 | 31 | 1115 |
| Justin Haley | 4 | 29.8 | 30.1 | 39.9 | 0 | 0 | 13 | 1180 |
| BJ McLeod | 4 | 31.3 | 31.9 | 36.0 | 0 | 0 | 3 | 1166 |
| Cody Ware | 4 | 32.3 | 32.4 | 35.4 | 0 | 0 | 4 | 1165 |
| Garrett Smithley | 4 | 33.3 | 33.8 | 32.9 | 0 | 0 | 0 | 1159 |
| Quin Houff | 4 | 34.0 | 34.0 | 30.7 | 0 | 0 | 0 | 1156 |
| Josh Bilicki | 4 | 36.3 | 36.2 | 27.2 | 0 | 0 | 0 | 1136 |
2021 Driver Averages w/ 550hp Package
| Kyle Busch | 10 | 03.7 | 07.1 | 112.9 | 197 | 187 | 2264 | 2523 |
| Kyle Larson | 10 | 06.9 | 04.7 | 122.8 | 406 | 1016 | 2333 | 2523 |
| Denny Hamlin | 10 | 07.5 | 07.6 | 108.3 | 118 | 245 | 2190 | 2523 |
| William Byron | 10 | 08.5 | 07.6 | 107.7 | 211 | 208 | 2194 | 2521 |
| Ryan Blaney | 10 | 09.1 | 10.3 | 99.3 | 104 | 44 | 2040 | 2522 |
| Kevin Harvick | 10 | 09.3 | 12.1 | 90.7 | 65 | 0 | 1808 | 2522 |
| Brad Keselowski | 10 | 09.9 | 10.7 | 98.0 | 123 | 193 | 1954 | 2519 |
| Martin Truex Jr | 10 | 09.9 | 10.1 | 93.7 | 80 | 63 | 2124 | 2514 |
| Alex Bowman | 10 | 11.2 | 10.4 | 94.1 | 79 | 39 | 1948 | 2519 |
| Tyler Reddick | 10 | 12.7 | 13.5 | 85.5 | 74 | 18 | 1706 | 2518 |
| Chase Elliott | 10 | 12.8 | 10.5 | 95.7 | 122 | 130 | 1984 | 2417 |
| Austin Dillon | 10 | 14.1 | 13.0 | 83.3 | 52 | 10 | 1848 | 2442 |
| Chris Buescher | 10 | 15.1 | 16.2 | 74.6 | 71 | 76 | 1048 | 2521 |
| Matt DiBenedetto | 10 | 15.4 | 14.2 | 78.4 | 24 | 3 | 1499 | 2518 |
| Kurt Busch | 10 | 15.8 | 12.1 | 89.7 | 126 | 158 | 1591 | 2049 |
| Joey Logano | 10 | 16.3 | 12.8 | 82.9 | 43 | 37 | 1820 | 2507 |
| Bubba Wallace | 10 | 17.4 | 18.2 | 70.8 | 23 | 5 | 997 | 2515 |
| Michael McDowell | 10 | 17.9 | 19.5 | 64.5 | 20 | 21 | 462 | 2514 |
| Daniel Suarez | 10 | 18.5 | 20.5 | 63.9 | 18 | 14 | 684 | 2500 |
| Chase Briscoe | 10 | 19.0 | 22.1 | 59.3 | 7 | 0 | 324 | 2516 |
| Christopher Bell | 10 | 19.4 | 16.4 | 74.6 | 51 | 9 | 1171 | 2509 |
| Ricky Stenhouse Jr | 10 | 20.1 | 17.9 | 67.9 | 18 | 23 | 1013 | 2402 |
| Ryan Newman | 10 | 21.2 | 20.1 | 63.5 | 34 | 0 | 730 | 2479 |
| Erik Jones | 10 | 22.3 | 21.9 | 58.4 | 31 | 0 | 420 | 2509 |
| Ryan Preece | 10 | 22.4 | 23.7 | 54.7 | 18 | 1 | 223 | 2505 |
| Aric Almirola | 10 | 23.0 | 21.1 | 61.2 | 6 | 8 | 356 | 2421 |
| Cole Custer | 10 | 24.2 | 22.1 | 51.8 | 3 | 1 | 270 | 2397 |
| Ross Chastain | 10 | 24.3 | 22.0 | 62.0 | 19 | 10 | 508 | 2428 |
| Anthony Alfredo | 10 | 27.0 | 26.4 | 45.5 | 3 | 4 | 95 | 2482 |
| Justin Haley | 9 | 28.4 | 29.4 | 40.8 | 9 | 0 | 38 | 2350 |
| Corey LaJoie | 9 | 28.8 | 26.2 | 46.7 | 30 | 0 | 43 | 2107 |
| Cody Ware | 10 | 30.5 | 31.6 | 36.7 | 1 | 0 | 22 | 2463 |
| BJ McLeod | 10 | 31.0 | 32.2 | 35.3 | 0 | 0 | 10 | 2457 |
| James Davison | 5 | 32.0 | 32.5 | 34.6 | 0 | 0 | 18 | 1032 |
| Garrett Smithley | 9 | 32.4 | 33.1 | 32.6 | 0 | 0 | 9 | 2121 |
| Quin Houff | 10 | 33.3 | 33.6 | 30.9 | 0 | 0 | 2 | 2437 |
| Josh Bilicki | 10 | 34.9 | 35.7 | 27.7 | 0 | 0 | 0 | 2383 |
2020 Driver Averages At “Low Wear” 1.5-Mile Tracks
| Brad Keselowski | 9 | 06.4 | 10.2 | 97.3 | 110 | 108 | 2025 | 2617 |
| Kevin Harvick | 9 | 07.2 | 09.2 | 106.9 | 186 | 328 | 2141 | 2616 |
| Ryan Blaney | 9 | 07.7 | 06.2 | 114.2 | 236 | 225 | 2433 | 2616 |
| Kyle Larson | 1 | 09.0 | 09.9 | 95.9 | 5 | 0 | 249 | 267 |
| Martin Truex Jr | 9 | 09.4 | 08.3 | 105.9 | 208 | 257 | 2170 | 2603 |
| Kyle Busch | 9 | 10.8 | 10.9 | 96.1 | 127 | 172 | 2012 | 2616 |
| Joey Logano | 9 | 11.0 | 08.8 | 105.6 | 68 | 219 | 2133 | 2526 |
| Kurt Busch | 9 | 11.8 | 11.9 | 91.4 | 77 | 85 | 2040 | 2546 |
| Denny Hamlin | 9 | 12.1 | 15.1 | 90.2 | 144 | 247 | 1534 | 2609 |
| Matt DiBenedetto | 9 | 12.6 | 12.5 | 88.2 | 22 | 40 | 1824 | 2525 |
| Austin Dillon | 9 | 13.6 | 12.8 | 84.6 | 20 | 23 | 1892 | 2594 |
| Chase Elliott | 9 | 13.9 | 08.8 | 103.6 | 226 | 257 | 2095 | 2615 |
| Alex Bowman | 9 | 14.9 | 08.7 | 100.2 | 178 | 269 | 2207 | 2600 |
| Aric Almirola | 9 | 14.9 | 14.7 | 84.6 | 90 | 164 | 1475 | 2615 |
| Cole Custer | 9 | 15.7 | 18.8 | 72.0 | 21 | 5 | 837 | 2502 |
| Erik Jones | 9 | 15.9 | 14.5 | 80.4 | 63 | 9 | 1451 | 2615 |
| Tyler Reddick | 9 | 16.0 | 15.5 | 75.8 | 43 | 5 | 1460 | 2505 |
| Christopher Bell | 9 | 16.9 | 17.8 | 72.2 | 42 | 5 | 939 | 2601 |
| William Byron | 9 | 17.7 | 12.6 | 85.5 | 86 | 57 | 1834 | 2534 |
| Ryan Newman | 8 | 19.9 | 20.5 | 62.0 | 11 | 1 | 471 | 2328 |
| Chris Buescher | 9 | 20.3 | 21.1 | 65.1 | 22 | 10 | 537 | 2507 |
| Ricky Stenhouse Jr | 9 | 21.1 | 20.6 | 68.1 | 20 | 31 | 581 | 2289 |
| Corey LaJoie | 9 | 22.1 | 24.8 | 52.0 | 8 | 1 | 162 | 2607 |
| Michael McDowell | 9 | 22.3 | 23.7 | 55.2 | 5 | 1 | 254 | 2591 |
| Ty Dillon | 9 | 22.6 | 24.7 | 53.7 | 3 | 0 | 155 | 2537 |
| Ross Chastain | 2 | 24.5 | 20.1 | 64.2 | 8 | 0 | 149 | 668 |
| Daniel Suarez | 9 | 26.3 | 28.7 | 44.4 | 4 | 0 | 20 | 2590 |
| Bubba Wallace | 9 | 27.1 | 23.9 | 55.1 | 4 | 0 | 290 | 1957 |
| Ryan Preece | 9 | 29.1 | 24.2 | 52.8 | 1 | 1 | 85 | 2252 |
| Josh Bilicki | 7 | 32.0 | 34.4 | 33.0 | 9 | 0 | 3 | 1842 |
| James Davison | 1 | 32.0 | 34.5 | 34.2 | 0 | 0 | 0 | 258 |
| Quin Houff | 9 | 32.6 | 33.9 | 34.1 | 2 | 0 | 1 | 2496 |
| Joey Gase | 9 | 34.6 | 36.1 | 28.8 | 4 | 0 | 1 | 2145 |
| BJ McLeod | 4 | 35.0 | 34.7 | 30.7 | 1 | 0 | 8 | 980 |
| Timmy Hill | 9 | 35.3 | 35.5 | 29.4 | 14 | 0 | 5 | 2051 |
DraftKings Strategy & Dominators for Texas
- With Texas Vegas Motor Speedway being a 1.5-mile track, and this race being 500 miles, we’re looking at 334 laps for Sunday night’s race. We should see a couple of dominators, and maybe even three depending on how it all turns out. Or, Kyle Larson could dominate the whole thing like he did at Charlotte this year. Still, I think your best bet this weekend is to go with a two-dominator build.
- Expect a lot of green flag racing this weekend. I’m estimating 305 of the 334 laps will be ran under green, which means 137.25 DraftKings FPTS for fastest laps. For laps led this week, the math on 334 laps is 83.5 DraftKings FPTS.
- NASCAR is running the 550hp package this weekend. Other tracks where this package has been ran this season are: Homestead, both Las Vegas races, both Atlanta races, Kansas, Charlotte, both Pocono races, and Michigan.
- Comparable tracks ran at this season would be the Charlotte, Kansas, and Las Vegas. The tire combination Goodyear is bringing this weekend is the same from the Las Vegas and Michigan races, and they’re using the same right side from Kansas. Charlotte, Kansas, and Las Vegas are the three “low wear” 1.5-mile tracks raced at this year, and if you go back to the 2020 season, you also have to throw in Texas (obviously).
Dominators
These are the potential dominators for this weekend’s race at Texas, and are listed in the order of likelihood according to my projections:
- Kyle Larson
- Denny Hamlin
- Kyle Busch
- Ryan Blaney
- William Byron
- Chase Elliott
- Martin Truex, Jr.
Some “surprise” dominators that could happen on Sunday night include: Brad Keselowski, Tyler Reddick, Joey Logano, and Alex Bowman.
Driver-by-Driver Breakdown Video
Now for the video breakdown! Be sure to go here and subscribe to my YouTube channel if you haven’t already.
Optimal Lineup According to Jordan’s Projections
The optimal DraftKings lineup for Texas on Sunday according to my Projections is:
- Kyle Larson
- Denny Hamlin
- Kyle Busch
- Austin Dillon
- Ricky Stenhouse, Jr.
- BJ McLeod
Confidence Rating = 6.8/10. It’s hard to be super confident with a punt like BJ McLeod in your lineup, but if you watch the breakdown video this week (above), it could end up making sense. The issue with this lineup is that you’re really needing Kyle Larson, Denny Hamlin, and Kyle Busch to all run top 3, and all pick up some dominator points. Is it possible? Absolutely. This is definitely a risky build, though…
GPP / Tournament Picks
First and foremost, I like being underweight on Kevin Harvick ($10,900) and Ross Chastain ($8,900) this weekend. Honestly, I doubt either of those two make it into my high-dollar DraftKings lineups this weekend. A 6th-place finish out of Harvick gets him 56 DraftKings FPTS, and has barely any dominator potential. Meanwhile, a guy like Kyle Busch ($9,800) can outscore Harvick with a 3rd-place finish, 25 laps led, and 20 fastest laps. I hate over-paying for purely place differential in DraftKings outside of superspeedways and road courses. As far as Chastain goes, he’s just been awful in this package and on “low-wear” 1.5-mile tracks this year.
Ryan Blaney ($9,500) – I’m a little concerned that too many people are talking about Ryan Blaney this weekend and that could shoot his ownership up, but at the same time, he’s a pretty solid play. Since Texas Motor Speedway was repaved before the 2017 season, Blaney has led 40+ laps in four of the eight races here, and a total of 403 over those races (an average of 50.4 per race). Looking at other tracks where this tire has been used this season, Blaney won at Michigan and finished 5th in both Las Vegas races. He’s also put up 10+ fastest laps in all four “low-wear” 1.5-mile races this season. Blaney is a legitimate top 5 threat on Sunday, and if he can get up there and lead, he’ll make a great pivot off of the Hamlin/Kyle Busch chalk.
Austin Dillon ($7,500) – In addition to getting a surprise strategy win here at Texas last year, Austin Dillon has just been solid at this race track over the years, with finishes of 14th or better in six of the last seven races here. Over the last five, he’s finished 11th or better in three of them. This year on the “low-wear” 1.5-mile tracks, AD came home 12th and 13th in the two Vegas races while finishing 6th at Charlotte and 10th at Kansas. A mid-$7,000 DraftKings driver has top 10 upside, and a little bit of place differential, too, as Austin starts 15th on Sunday. That’s a great value.
Bubba Wallace ($6,400) – Joe Gibbs Racing has a little bit of an advantage here at Texas Motor Speedway, and even though Bubba Wallace is a bit of a risky play starting 18th, he does have mid-teens finishing potential (or better). Bubba ran 16th in the Las Vegas Playoff race a few weeks back and also came home 14th in the Coca-Cola 600 at Charlotte this year. Additionally, he’s finished 16th or better in six of the ten 550hp package races this year, with only three results outside of the top 20. With Richard Petty Motorsports, Bubba had some decent runs here at Texas, including an 8th back in 2018 and a 14th in the summer race here last season.
Stacking Dennys Podcast with Jordan & RotoDoc
Cash Core Drivers
Kyle Larson ($10,500) – If you have an argument against playing Kyle Larson this weekend, I’d love to hear it. “Yung Money” has had 43+ fastest laps in every single “low-wear” 1.5-mile race this season and has led 95+ laps in all four of them as well. He is at or near the top in every significant statistical category for both 1.5-mile tracks and in the 550hp package this season, plus he starts on the pole. Sometimes this #5 Chevrolet isn’t great to start off a race, but with Sunday’s event being 500 miles, that kind of helps Larson if that happens, because this team is masterful at making the car faster throughout the race. I’ll go 100% Larson on Sunday and not think twice about it.
Kyle Busch ($9,800) – It’s a tossup for me on Denny Hamlin ($9,900) and Kyle Busch in this second spot. I’m going to recommend Kyle Busch simply because he comes at a $100 discount and also starts one spot further back, but both of these drivers have similar upside and should both contend for the win. Looking at the “low-wear” 1.5-mile tracks this year, Busch has an average finish of 2.5 and has posted 22+fastest laps in three of the four races despite only leading a total of 23 laps. In other words, Rowdy is fast even when he’s not out front, and that’s what you like to see. In the ten races with the 550hp package this season, Busch has another ridiculous average finish (3.7) and has the 3rd-most dominator points behind Larson and Byron.
Ricky Stenhouse, Jr. ($7,200) – There’s always a tiny bit of risk when you roll with Ricky Stenhouse, Jr. since he sometimes wrecks out, but we don’t see many cars have issues at Texas Motor Speedway, so I’m not overly worried about that happening on Sunday. On the “low-wear” 1.5-mile tracks this season, Stenhouse has finished 17th, 11th, 12th, and 34th, and in the 550hp package race he’s came home 15th or better in six of the ten races (and also has a 17th to his credit as well). Ricky starts 27th here at Texas on Sunday and should be a strong DraftKings play.
Autotrader EchoPark Automotive 500 at Texas DraftKings Driver Projections
The following chart takes into account the very basics: the starting position and the projected finish of each driver. The projected finishes are averaged from six different ranking systems. Also factored in are projected laps led and fastest laps for each driver. You can click the headers below to sort the chart by that attribute. By default it is sorted by average projected FPTS.
NOTE: If you’re using my projections this week in an optimizer, I’d recommend making a rule of only using two of Larson/Hamlin/Kyle Busch. It’s worth having some lineups with all three, but for the most part, I’d do a rule with just two of them. The optimizer will try to force all three in to most lineups if you don’t.
| Driver | DraftKings Salary | Avg Proj FPTS | Proj Ownership | Starting Position | Ceiling Proj FPTS | Avg. Projected Finish | Dollar Per FPT |
|---|---|---|---|---|---|---|---|
| Kyle Larson | $10,500 | 88.43 | 42.26% | 1 | 124.10 | 02.5 | $119 |
| Kyle Busch | $9,800 | 70.83 | 34.45% | 3 | 100.50 | 03.3 | $138 |
| Denny Hamlin | $9,900 | 70.45 | 35.28% | 2 | 99.95 | 03.2 | $141 |
| William Byron | $9,600 | 54.53 | 22.62% | 12 | 70.85 | 07.2 | $176 |
| Ryan Blaney | $9,500 | 54.50 | 19.96% | 4 | 67.00 | 05.3 | $174 |
| Martin Truex Jr | $10,300 | 53.10 | 15.43% | 8 | 78.45 | 05.5 | $194 |
| Kevin Harvick | $10,900 | 48.75 | 23.03% | 24 | 59.75 | 11.0 | $224 |
| Chase Elliott | $10,100 | 48.68 | 22.12% | 6 | 59.70 | 06.8 | $207 |
| Brad Keselowski | $8,500 | 44.93 | 17.22% | 7 | 58.05 | 08.5 | $189 |
| Kurt Busch | $8,700 | 44.52 | 19.30% | 17 | 61.35 | 10.7 | $195 |
| Austin Dillon | $7,500 | 40.90 | 18.76% | 15 | 51.25 | 10.5 | $183 |
| Tyler Reddick | $7,700 | 40.55 | 15.52% | 9 | 55.60 | 10.5 | $190 |
| Alex Bowman | $9,300 | 40.50 | 24.36% | 14 | 57.75 | 10.7 | $230 |
| Ricky Stenhouse Jr | $7,200 | 37.40 | 30.25% | 27 | 43.60 | 16.8 | $193 |
| Ross Chastain | $8,900 | 31.80 | 24.55% | 25 | 41.80 | 19.2 | $280 |
| Joey Logano | $9,100 | 31.70 | 14.48% | 5 | 51.90 | 10.8 | $287 |
| Matt DiBenedetto | $7,400 | 31.57 | 14.28% | 13 | 46.80 | 12.3 | $234 |
| Christopher Bell | $8,300 | 31.10 | 18.62% | 11 | 45.95 | 13.7 | $267 |
| Ryan Newman | $7,000 | 29.12 | 14.96% | 31 | 34.45 | 22.2 | $240 |
| Chase Briscoe | $7,900 | 28.83 | 11.73% | 26 | 40.35 | 20.2 | $274 |
| Bubba Wallace | $6,400 | 25.63 | 15.52% | 18 | 38.15 | 19.0 | $250 |
| Chris Buescher | $6,500 | 23.92 | 4.70% | 10 | 36.70 | 16.7 | $272 |
| Daniel Suarez | $6,900 | 21.40 | 16.71% | 19 | 26.90 | 21.0 | $322 |
| Erik Jones | $6,600 | 20.85 | 16.69% | 21 | 27.80 | 22.3 | $317 |
| Michael McDowell | $5,800 | 18.62 | 6.17% | 16 | 29.90 | 20.3 | $312 |
| Anthony Alfredo | $5,600 | 18.45 | 18.68% | 28 | 20.45 | 26.2 | $304 |
| Aric Almirola | $8,100 | 17.50 | 7.48% | 22 | 22.45 | 23.2 | $463 |
| Ryan Preece | $6,000 | 17.12 | 17.61% | 23 | 30.90 | 24.7 | $351 |
| Corey Lajoie | $5,700 | 15.45 | 20.16% | 29 | 19.90 | 28.2 | $369 |
| BJ McLeod | $4,900 | 12.17 | 5.24% | 35 | 17.00 | 32.3 | $403 |
| Cole Custer | $6,200 | 11.28 | 16.24% | 20 | 19.35 | 26.0 | $549 |
| Justin Haley | $6,800 | 11.00 | 3.24% | 32 | 16.00 | 31.0 | $618 |
| Cody Ware | $4,700 | 09.83 | 4.25% | 34 | 11.00 | 32.5 | $478 |
| Joey Gase | $5,100 | 09.50 | 2.55% | 37 | 16.00 | 34.3 | $537 |
| Garrett Smithley | $4,800 | 08.67 | 2.80% | 36 | 11.00 | 34.3 | $554 |
| Timmy Hill | $5,400 | 04.33 | 0.66% | 39 | 08.00 | 37.7 | $1,246 |
| Josh Bilicki | $5,000 | 03.67 | 0.97% | 33 | 08.00 | 35.3 | $1,364 |
| David Starr | $5,300 | 02.17 | 0.68% | 38 | 05.00 | 38.3 | $2,446 |
| Quin Houff | $4,500 | 01.83 | 0.47% | 30 | 05.00 | 34.7 | $2,455 |


