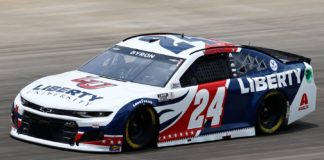
The NASCAR Cup Series rolls into Atlanta Motor Speedway this weekend for the Quaker State 400. It’s been quite a while since NASCAR has raced at Atlanta in July, and although there is a chance of rain this weekend, it’s looking like it’s going to be a hot and slick day for these drivers. The last time we were here (in March of this year), Kyle Larson dominated the race but then Ryan Blaney won it at the end with Alex Bowman coming home 3rd. Chase Elliott is on the pole this weekend and you can check out the full starting lineup by clicking here.
Also, make sure you check out this week’s episode of Stacking Dennys, the new podcast that RotoDoc and I host. Click here for more information on that. Finally, make sure you check out my FanDuel article for this race as well (click here), as there is often quite a bit of similarities between the two DFS sites. Now let’s goooo!!!!
LIVE STREAM INFORMATION: I will be joining Brandon Cruz on his YouTube channel on Sunday to break down this slate. We plan on going live at noon Eastern on Sunday. Click here to tune in.
Enjoy the FREE content that this site offers each week? Consider donating to support by clicking here. Also, be sure to check out the Algorithm Predicted Finishing Order for this race by clicking here!
Speed Report & Loop Data Driver Averages
Atlanta Motor Speedway is a 1.54-mile, “high-wear” race track and we actually have quite a bit of recent and relevant data to look at this weekend. I’ll be focusing on three main cores: recent Atlanta performance, driver performance on “high-wear” tracks this season (Homestead, Darlington, and the first Atlanta race), and then driver performance on 1.5-mile intermediate tracks with the 550hp package this season (Homestead, Las Vegas, Atlanta, Kansas, and Charlotte). Of course you can also look back to recent season with all of this, but the charts below are for 2021 unless otherwise noted. The following information is included:
- Starts
- Finish
- ARP = average running position
- DR = driver rating
- FL = fastest laps (total)
- LL = laps led (total)
- T15 = laps ran inside top 15 (total)
- Total Laps = laps completed (total)
2019-2021 Driver Averages At Atlanta
| Kyle Busch | 3 | 04.3 | 07.0 | 106.9 | 64 | 7 | 913 | 975 |
| Martin Truex Jr | 3 | 04.7 | 05.1 | 116.7 | 96 | 69 | 973 | 975 |
| Kevin Harvick | 3 | 05.0 | 08.6 | 114.8 | 89 | 196 | 764 | 975 |
| Denny Hamlin | 3 | 06.7 | 06.8 | 104.0 | 23 | 27 | 946 | 975 |
| Kyle Larson | 2 | 07.0 | 03.7 | 131.0 | 158 | 411 | 591 | 650 |
| Ryan Blaney | 3 | 09.0 | 06.5 | 109.2 | 66 | 68 | 922 | 974 |
| Alex Bowman | 3 | 10.0 | 11.4 | 90.8 | 20 | 0 | 662 | 974 |
| Brad Keselowski | 3 | 12.7 | 13.0 | 90.7 | 52 | 38 | 690 | 971 |
| Chris Buescher | 3 | 12.7 | 16.4 | 75.9 | 12 | 0 | 452 | 974 |
| Austin Dillon | 3 | 12.7 | 16.8 | 74.8 | 8 | 0 | 355 | 973 |
| Ryan Newman | 3 | 13.3 | 15.9 | 75.4 | 2 | 0 | 543 | 974 |
| Ricky Stenhouse Jr | 3 | 14.3 | 14.9 | 83.0 | 11 | 1 | 633 | 973 |
| Aric Almirola | 3 | 15.0 | 15.6 | 76.3 | 26 | 36 | 332 | 973 |
| Joey Logano | 3 | 16.0 | 11.6 | 86.3 | 47 | 32 | 782 | 973 |
| Kurt Busch | 3 | 16.0 | 12.5 | 90.8 | 25 | 3 | 699 | 763 |
| Cole Custer | 2 | 18.5 | 19.5 | 64.4 | 1 | 0 | 50 | 648 |
| Daniel Suarez | 3 | 19.3 | 19.4 | 66.3 | 10 | 1 | 447 | 965 |
| William Byron | 3 | 19.3 | 20.3 | 68.1 | 7 | 2 | 365 | 963 |
| Christopher Bell | 2 | 19.5 | 19.4 | 65.9 | 2 | 0 | 94 | 647 |
| Erik Jones | 3 | 19.7 | 18.2 | 71.9 | 17 | 0 | 402 | 970 |
| Matt DiBenedetto | 3 | 20.7 | 15.6 | 72.9 | 5 | 0 | 526 | 971 |
| Tyler Reddick | 2 | 21.0 | 22.4 | 62.4 | 5 | 0 | 133 | 647 |
| Bubba Wallace | 3 | 21.3 | 21.9 | 58.4 | 1 | 0 | 127 | 970 |
| Chase Elliott | 3 | 21.7 | 12.7 | 83.4 | 19 | 26 | 729 | 869 |
| Ross Chastain | 2 | 22.5 | 26.2 | 51.9 | 5 | 0 | 69 | 638 |
| Chase Briscoe | 1 | 23.0 | 25.2 | 50.2 | 1 | 0 | 3 | 323 |
| Michael McDowell | 3 | 26.7 | 24.0 | 52.0 | 7 | 0 | 25 | 870 |
| Anthony Alfredo | 1 | 27.0 | 27.9 | 44.8 | 0 | 0 | 0 | 322 |
| Corey LaJoie | 3 | 28.3 | 28.3 | 45.8 | 37 | 0 | 10 | 961 |
| Ryan Preece | 3 | 28.7 | 23.4 | 53.9 | 7 | 0 | 59 | 917 |
| Justin Haley | 1 | 30.0 | 30.7 | 42.0 | 9 | 0 | 0 | 319 |
| James Davison | 1 | 32.0 | 33.4 | 35.2 | 0 | 0 | 0 | 316 |
| Cody Ware | 2 | 32.0 | 34.0 | 31.8 | 0 | 0 | 0 | 619 |
| Quin Houff | 2 | 32.5 | 32.6 | 36.0 | 0 | 0 | 1 | 628 |
| BJ McLeod | 3 | 35.3 | 34.0 | 28.4 | 2 | 0 | 0 | 629 |
| Garrett Smithley | 2 | 35.5 | 34.9 | 28.8 | 0 | 0 | 0 | 566 |
| Josh Bilicki | 2 | 35.5 | 36.3 | 31.1 | 0 | 0 | 0 | 598 |
2021 Driver Averages Under 550hp Intermediate Package
| Kyle Busch | 5 | 04.4 | 08.1 | 104.4 | 82 | 21 | 1327 | 1526 |
| Kyle Larson | 5 | 05.4 | 02.6 | 135.9 | 315 | 836 | 1517 | 1526 |
| William Byron | 5 | 06.0 | 06.0 | 113.4 | 137 | 148 | 1444 | 1526 |
| Denny Hamlin | 5 | 07.6 | 08.4 | 102.6 | 51 | 84 | 1292 | 1526 |
| Austin Dillon | 5 | 09.2 | 11.0 | 91.0 | 35 | 1 | 1272 | 1526 |
| Kevin Harvick | 5 | 09.4 | 11.7 | 93.4 | 41 | 0 | 1063 | 1525 |
| Martin Truex Jr | 5 | 10.6 | 09.5 | 96.4 | 43 | 43 | 1362 | 1517 |
| Chris Buescher | 5 | 11.2 | 13.7 | 85.4 | 57 | 70 | 824 | 1526 |
| Brad Keselowski | 5 | 12.0 | 10.9 | 99.2 | 89 | 152 | 1111 | 1522 |
| Alex Bowman | 5 | 12.4 | 10.2 | 93.1 | 39 | 5 | 1196 | 1524 |
| Tyler Reddick | 5 | 13.2 | 16.8 | 78.1 | 41 | 13 | 784 | 1523 |
| Ryan Blaney | 5 | 13.8 | 10.7 | 95.6 | 71 | 28 | 1172 | 1525 |
| Chase Elliott | 5 | 14.4 | 10.2 | 93.7 | 73 | 48 | 1240 | 1421 |
| Michael McDowell | 5 | 15.0 | 19.0 | 67.3 | 6 | 9 | 255 | 1522 |
| Matt DiBenedetto | 5 | 15.4 | 14.7 | 77.3 | 11 | 2 | 833 | 1522 |
| Ryan Newman | 5 | 16.2 | 18.8 | 71.0 | 17 | 0 | 612 | 1521 |
| Ricky Stenhouse Jr | 5 | 16.4 | 14.9 | 76.2 | 14 | 23 | 857 | 1517 |
| Joey Logano | 5 | 16.6 | 13.5 | 80.3 | 13 | 19 | 1043 | 1523 |
| Daniel Suarez | 5 | 16.8 | 19.4 | 67.7 | 17 | 14 | 395 | 1521 |
| Christopher Bell | 5 | 20.0 | 16.4 | 73.4 | 32 | 3 | 680 | 1519 |
| Erik Jones | 5 | 20.4 | 21.5 | 60.8 | 28 | 0 | 285 | 1520 |
| Ross Chastain | 5 | 21.0 | 22.7 | 63.4 | 16 | 0 | 337 | 1484 |
| Chase Briscoe | 5 | 21.0 | 24.6 | 53.8 | 2 | 0 | 28 | 1520 |
| Bubba Wallace | 5 | 21.2 | 20.0 | 65.3 | 15 | 2 | 504 | 1519 |
| Cole Custer | 5 | 22.2 | 20.9 | 58.0 | 0 | 0 | 241 | 1520 |
| Kurt Busch | 5 | 23.8 | 16.0 | 75.4 | 43 | 1 | 753 | 1052 |
| Ryan Preece | 5 | 23.8 | 24.2 | 52.7 | 7 | 0 | 108 | 1512 |
| Anthony Alfredo | 5 | 24.6 | 24.8 | 49.8 | 1 | 4 | 79 | 1518 |
| Aric Almirola | 5 | 27.8 | 22.9 | 53.6 | 0 | 0 | 122 | 1427 |
| Justin Haley | 5 | 28.6 | 29.7 | 41.0 | 9 | 0 | 21 | 1505 |
| Corey LaJoie | 5 | 29.6 | 26.2 | 46.4 | 29 | 0 | 35 | 1321 |
| BJ McLeod | 5 | 32.0 | 33.0 | 34.2 | 0 | 0 | 2 | 1480 |
| Cody Ware | 5 | 32.2 | 32.9 | 34.5 | 0 | 0 | 2 | 1482 |
| Garrett Smithley | 4 | 32.3 | 33.0 | 34.3 | 0 | 0 | 2 | 1168 |
| Quin Houff | 5 | 34.0 | 33.6 | 31.5 | 0 | 0 | 1 | 1473 |
| James Davison | 3 | 34.0 | 33.7 | 31.7 | 0 | 0 | 0 | 765 |
| Josh Bilicki | 5 | 35.8 | 36.3 | 27.5 | 0 | 0 | 0 | 1428 |
2021 Driver Averages At High-Wear Tracks
| Kyle Larson | 3 | 02.7 | 04.3 | 124.5 | 133 | 274 | 869 | 885 |
| Martin Truex Jr | 3 | 04.3 | 05.4 | 120.6 | 95 | 285 | 874 | 885 |
| William Byron | 3 | 04.3 | 06.0 | 116.7 | 41 | 104 | 870 | 885 |
| Kyle Busch | 3 | 06.0 | 09.6 | 97.7 | 32 | 9 | 688 | 885 |
| Denny Hamlin | 3 | 06.7 | 07.5 | 104.0 | 25 | 32 | 760 | 885 |
| Kevin Harvick | 3 | 07.0 | 12.1 | 95.2 | 23 | 10 | 641 | 885 |
| Alex Bowman | 3 | 09.7 | 09.4 | 94.6 | 20 | 0 | 752 | 883 |
| Ryan Newman | 3 | 10.0 | 13.7 | 82.1 | 4 | 0 | 696 | 884 |
| Austin Dillon | 3 | 11.3 | 12.6 | 85.6 | 10 | 0 | 584 | 883 |
| Chris Buescher | 3 | 11.7 | 10.5 | 91.8 | 55 | 58 | 745 | 885 |
| Ryan Blaney | 3 | 12.7 | 09.3 | 96.4 | 34 | 25 | 736 | 884 |
| Tyler Reddick | 3 | 13.3 | 18.5 | 75.7 | 16 | 2 | 397 | 882 |
| Ricky Stenhouse Jr | 3 | 15.0 | 17.4 | 71.0 | 14 | 0 | 340 | 882 |
| Ross Chastain | 3 | 15.3 | 17.6 | 71.1 | 3 | 10 | 308 | 883 |
| Michael McDowell | 3 | 17.3 | 19.5 | 67.4 | 17 | 0 | 157 | 879 |
| Chase Briscoe | 3 | 17.3 | 21.9 | 60.7 | 1 | 0 | 191 | 882 |
| Joey Logano | 3 | 17.7 | 11.0 | 88.9 | 14 | 12 | 735 | 883 |
| Christopher Bell | 3 | 18.3 | 17.0 | 69.5 | 11 | 3 | 295 | 882 |
| Daniel Suarez | 3 | 18.3 | 19.7 | 64.1 | 9 | 2 | 209 | 881 |
| Matt DiBenedetto | 3 | 19.3 | 14.1 | 73.3 | 7 | 0 | 473 | 881 |
| Chase Elliott | 3 | 19.7 | 14.2 | 81.8 | 14 | 4 | 656 | 780 |
| Bubba Wallace | 3 | 19.7 | 19.8 | 62.5 | 7 | 2 | 98 | 881 |
| Brad Keselowski | 3 | 22.7 | 16.5 | 78.6 | 61 | 51 | 390 | 878 |
| Erik Jones | 3 | 23.0 | 22.5 | 55.9 | 25 | 0 | 107 | 880 |
| Ryan Preece | 3 | 23.7 | 24.9 | 52.2 | 3 | 0 | 4 | 880 |
| Cole Custer | 3 | 25.7 | 17.8 | 59.7 | 6 | 0 | 214 | 688 |
| Anthony Alfredo | 3 | 25.7 | 27.4 | 46.1 | 0 | 0 | 5 | 878 |
| Kurt Busch | 3 | 27.3 | 17.0 | 73.3 | 43 | 1 | 356 | 486 |
| Justin Haley | 3 | 28.0 | 29.2 | 40.7 | 12 | 0 | 11 | 873 |
| Aric Almirola | 3 | 29.0 | 19.9 | 46.7 | 0 | 0 | 93 | 593 |
| Corey LaJoie | 3 | 29.0 | 26.7 | 47.2 | 29 | 0 | 5 | 760 |
| Garrett Smithley | 1 | 31.0 | 31.3 | 36.7 | 0 | 0 | 2 | 263 |
| Cody Ware | 3 | 32.3 | 33.1 | 33.7 | 0 | 1 | 4 | 765 |
| Quin Houff | 3 | 32.7 | 32.5 | 33.4 | 0 | 0 | 2 | 858 |
| James Davison | 3 | 33.3 | 33.2 | 31.8 | 0 | 0 | 1 | 663 |
| BJ McLeod | 3 | 33.3 | 34.0 | 32.2 | 0 | 0 | 0 | 856 |
| Josh Bilicki | 3 | 34.3 | 35.3 | 28.8 | 0 | 0 | 0 | 789 |
DraftKings Strategy & Dominators for Atlanta
This is looking like a great weekend of building DraftKings lineups. Kyle Larson should be the main projected dominator by most people, and he’s going to be a popular pick. Obviously there’s going to be strategy there in going a different route, but do you really want to bet against the fastest guy in NASCAR at one of his best tracks? With Larson’s DraftKings salary, though, it then comes down to how you build the rest of your lineup: do you go with three sub-$7,000 drivers and then two more studs, or try to even it out a bit?
- There are 260 laps scheduled for Sunday’s Quaker State 400, which is 65 less laps than the last time we raced at Atlanta. This is significant because it lowers the potential dominator points a bit. Still, there will be 65 DraftKings FPTS up for grabs for laps led and approximately 220 green flag laps, giving us an additional 99 (estimated) DraftKings FPTS up for grabs for fastest laps.
- With around 165 DraftKings dominator FPTS possible this weekend, lineup construction is really going to come down to how many drivers dominate the race. We typically only see one main dominator here, but two dominators are possible.
- Keep an eye on the weather. If this race gets shortened by rain, that should put a bigger emphasis on place differential and finishing position as opposed to focusing so heavily on dominator points.
Dominators
These are the potential dominators for Sunday’s race at Atlanta, and are listed in the order of likelihood according to my projections:
- Kyle Larson
- Kyle Busch
- Ryan Blaney
- Chase Elliott
- William Byron
- Alex Bowman
- Kevin Harvick
Some “surprise” dominators that could happen on Sunday include: Denny Hamlin, Kurt Busch, Martin Truex, Jr., and Brad Keselowski.
Driver-by-Driver Breakdown Video
Now for the video breakdown! Be sure to go here and subscribe to my YouTube channel if you haven’t already.
Optimal Lineup According to Jordan’s Projections
The optimal DraftKings lineup for Atlanta according to my Projections is:
- Kyle Larson
- William Byron
- Alex Bowman
- Ricky Stenhouse, Jr.
- Ryan Newman
- Michael McDowell
Confidence Rating = 7.8/10. It’s hard to dislike this lineup as a core build to work with on Sunday. All of the Hendrick Chevrolets should be strong, and while you have the dominating force with Larson in this lineup, you also have place differential and finishing potential with Byron and Bowman. With the lower guys, Stenhouse has top 10 potential, Newman is major chalk, and McDowell just needs to crack the top 20. Do I think this will be the optimal lineup on Sunday? No, but it’s a good base to work with.
GPP / Tournament Picks
Kyle Busch ($10,300) – In the last Atlanta race, it was a one dominator event, as Kyle Larson just blew everyone else out of the water. And although I do think that that is the most likely scenario to happen here again on Sunday, it’s not a guarantee. And if this becomes a two dominator race, I love pairing Kyle Busch with Kyle Larson, especially to get off of the place differential chalk in this price range. Rowdy is predicted to finish 2nd by my algorithm this weekend and when you look at the recent 550hp intermediate races, he’s finished 3rd (Charlotte), 1st (Kansas), 5th (Atlanta), and 3rd (Las Vegas). Busch also has the 3rd-most fastest laps on the intermediates with the 550hp package this season. Here at Atlanta, Kyle is pretty much a lock for 15-20 fastest laps each time, so if he hits that and grabs a good chunk of laps led on Sunday, he’ll be a great tournament play despite starting 2nd.
Brad Keselowski ($9,200) – If you’re looking to get off of the Alex Bowman chalk this weekend, pivoting to Brad Keselowski could be a solid option–or you could even combine the two drivers into the same lineup. This #2 team laid an egg the last time here at Atlanta, but Kez has shown potential at other 550hp intermediate tracks this season. Focusing on fastest laps, he had 28 at Homestead, 30 at Las Vegas, and 18 at Kansas, and in the two races here at Atlanta prior to this season’s first event, he had 19 fastest laps (in 2020) and 28 fastest laps (in 2019). Further, Keselowski posted 28 fastest laps at both Homestead and Darlington this season, the other two “high-wear” tracks. He’s finished 9th or better in six of his last seven starts here at Atlanta, and that includes a three-race stretch of top 2 finishes from 2017 to 2019. A top 5 out of BK on Sunday would make him a great value at just a $9,200 salary on DraftKings.
Ricky Stenhouse, Jr. ($6,600) – I actually think Ricky Stenhouse, Jr. is going to come in at a higher ownership percentage than most of think he will, but there’s a chance he gets passed up for place differential plays by a lot of DraftKings players, so I’m writing him up a tournament pick. Over the last six Atlanta races, Stenhouse has finished 18th or better in each of them, and 13th or better in four of them. He starts 16th this weekend, and it wouldn’t be surprising if he challenges for a top 10 finish on Sunday. In the 550hp package on intermediates this year, Stenhouse has an average running position of 14.9 and an average finish of 16.4, but that’s brought down quite a bit by his 34th-place finish at Kansas. The other four races (Homestead, Las Vegas, Atlanta, and Charlotte)? His worst finish is 13th.
Cash Core Drivers
Kyle Larson ($12,000) – The last time we were at Atlanta, Kyle Larson put up 104 fastest laps and 269 laps led. In his previous start at this track (in 2019, with Chip Ganassi Racing) he put up 54 fastest laps and 142 laps led. The only way Kyle Larson doesn’t crush the competition again here on Sunday is if he has a mechanical issue or wrecks–neither of which I’m in the business of predicting. He’s the most solid play there is, even at that heightened DraftKings salary of $12,000. Don’t over-think this one.
Alex Bowman ($9,400) – Alex Bowman and this #48 team are finally finding some consistency, so the fact that DraftKings has him priced at $9,400 this weekend when he’s starting back in 17th makes him an excelling cash lineup play. It he would have finished where he should have at Road America, Bowman would be coming into Atlanta with finishes of 9th or better in seven of the last eight races, but instead that number is six of the last eight. Still solid. AB ran 3rd here at Atlanta last time we raced at this track and has the 7th-best average running position here over the last three races. He ranks 6th in that category on “high-wear” tracks this season and 6th on intermediates with the 550hp package in 2021 as well. My algorithm loves Bowman this week and actually has him predicted to finish 4th.
Ryan Newman ($6,100) – Holy chalk, Rocketman! For some reason, DraftKings priced Ryan Newman at $6,100 this weekend even though he’s starting 29th, and we have another Pocono weekend on our hands as far as the chalkiest driver in the field. Newman has an average finish of 16.2 on the intermediates with this 550hp package this season, and on the “high-wear” tracks in 2021, his average result is 10.0. Here at Atlanta, he’s finished 13th, 14th, and 13th over the last three years with the 550hp package. Even a bad day out of Newman should be a top 20 finish. He’s a must-have in cash lineups.
Atlanta Quaker State 400 DraftKings Driver Projections
The following chart takes into account the very basics: the starting position and the projected finish of each driver. The projected finishes are averaged from six different ranking systems. Also factored in are projected laps led and fastest laps for each driver. You can click the headers below to sort the chart by that attribute. By default it is sorted by average projected FPTS.
| Driver | DraftKings Salary | Avg Proj FPTS | Proj Ownership | Starting Position | Ceiling Proj FPTS | Avg. Projected Finish | Dollar Per FPT |
|---|---|---|---|---|---|---|---|
| Kyle Larson | $12,000 | 94.67 | 45.89% | 6 | 119.00 | 02.2 | $127 |
| Kevin Harvick | $10,900 | 62.28 | 16.93% | 21 | 74.30 | 06.5 | $175 |
| William Byron | $10,000 | 62.08 | 31.55% | 19 | 81.75 | 05.2 | $161 |
| Ryan Blaney | $10,500 | 61.80 | 26.92% | 15 | 74.95 | 06.2 | $170 |
| Kyle Busch | $10,300 | 59.22 | 22.84% | 2 | 76.60 | 02.5 | $174 |
| Alex Bowman | $9,400 | 56.73 | 34.04% | 17 | 73.00 | 07.0 | $166 |
| Denny Hamlin | $9,600 | 51.03 | 18.48% | 3 | 64.05 | 03.0 | $188 |
| Martin Truex Jr | $9,000 | 42.00 | 18.41% | 5 | 61.25 | 06.5 | $214 |
| Ryan Newman | $6,100 | 38.78 | 56.50% | 29 | 51.80 | 16.7 | $157 |
| Austin Dillon | $7,900 | 36.68 | 15.07% | 13 | 46.35 | 10.8 | $215 |
| Chris Buescher | $8,600 | 36.42 | 13.97% | 18 | 46.25 | 13.8 | $236 |
| Chase Elliott | $9,800 | 35.83 | 21.68% | 1 | 63.85 | 10.3 | $273 |
| Kurt Busch | $8,400 | 35.15 | 12.04% | 8 | 52.05 | 12.3 | $239 |
| Brad Keselowski | $9,200 | 34.08 | 19.36% | 14 | 58.95 | 11.7 | $270 |
| Ricky Stenhouse Jr | $6,600 | 33.18 | 17.14% | 16 | 38.35 | 14.3 | $199 |
| Daniel Suarez | $7,700 | 32.02 | 16.87% | 27 | 45.35 | 20.3 | $240 |
| Joey Logano | $8,800 | 31.85 | 19.71% | 10 | 38.25 | 11.8 | $276 |
| Matt DiBenedetto | $7,500 | 28.85 | 13.78% | 12 | 37.35 | 14.2 | $260 |
| Bubba Wallace | $6,300 | 28.07 | 19.53% | 24 | 39.90 | 20.2 | $224 |
| Tyler Reddick | $7,100 | 27.65 | 9.97% | 7 | 40.15 | 13.2 | $257 |
| Michael McDowell | $5,900 | 27.25 | 25.41% | 25 | 34.25 | 21.5 | $217 |
| Ryan Preece | $7,400 | 23.67 | 16.65% | 34 | 28.00 | 26.3 | $313 |
| Ross Chastain | $7,200 | 22.12 | 4.41% | 9 | 39.90 | 15.8 | $326 |
| Aric Almirola | $8,000 | 21.00 | 17.12% | 20 | 35.00 | 21.0 | $381 |
| Cole Custer | $6,700 | 20.95 | 20.15% | 23 | 28.45 | 23.3 | $320 |
| Christopher Bell | $8,200 | 20.27 | 5.63% | 4 | 34.60 | 14.8 | $405 |
| Erik Jones | $6,900 | 20.13 | 15.05% | 22 | 30.80 | 23.3 | $343 |
| Corey Lajoie | $5,700 | 18.57 | 9.15% | 26 | 35.90 | 25.8 | $307 |
| Anthony Alfredo | $5,500 | 18.00 | 16.49% | 32 | 22.00 | 28.2 | $306 |
| Garrett Smithley | $5,300 | 11.50 | 3.81% | 37 | 16.00 | 33.7 | $461 |
| BJ McLeod | $5,000 | 10.33 | 0.98% | 36 | 13.00 | 33.3 | $484 |
| Quin Houff | $4,500 | 09.67 | 1.04% | 35 | 17.00 | 33.5 | $466 |
| Justin Haley | $4,900 | 09.33 | 7.38% | 28 | 14.00 | 30.2 | $525 |
| Chase Briscoe | $6,400 | 08.33 | 4.43% | 11 | 18.00 | 22.8 | $768 |
| Cody Ware | $5,200 | 07.83 | 0.82% | 31 | 10.00 | 32.2 | $664 |
| Bayley Currey | $4,700 | 04.33 | 0.44% | 33 | 08.00 | 34.8 | $1,085 |
| Josh Bilicki | $4,600 | 00.17 | 0.36% | 30 | 07.00 | 35.2 | $27,600 |


