It’s Throwback Weekend at Darlington Raceway with the Goodyear 400 on Sunday afternoon. The weather forecast says it’s going to be in the mid-80s and partly cloudy, so it should make for some great racing and a slicker track surface. Darlington is a “high-wear” race track that is pretty unique and hard to compare to any other track on the circuit. The cream definitely rises to the top at this track, and you can expect the most talented drivers to be in the running for the win on Sunday.
Click here to check out my DraftKings post for this race. It’s a little bit more in-depth than this FanDuel post and there’s a lot of crossover with drivers between these two DFS sites. Also, my algorithm predicted finishing order is a great tool to check out as well. Click here to look at that.
If you enjoy the FREE NASCAR content on this site, consider supporting by donating here.
Driver Loop Data Averages at Darlington
Darlington is such a unique track that it’s important to analyze the data from just this venue. So, below you will find two charts: the first one has Darlington data from 2019 and 2020, four races total. And then the second chart will show you the 2016-2018 data, which is when NASCAR race the low downforce package at Darlington.
Darlington is also a “high-wear” race track, and we’ve had two races on that type this season: Homestead and Atlanta. You can click here for Green Flag Speed from Homestead, and click here for the full Loop Data Box Score from Homestead. Also, you can click here for Green Flag Speed from Atlanta, and click here for the full Loop Data Box Score from Atlanta.
| Kyle Larson | 1 | 02.0 | 04.3 | 160.92 | 127.2 | 40 | 44 | 361 | 367 |
| Kevin Harvick | 4 | 02.3 | 07.0 | 159.52 | 118.7 | 105 | 201 | 1149 | 1235 |
| Erik Jones | 4 | 04.5 | 08.8 | 159.20 | 105.8 | 39 | 106 | 1120 | 1235 |
| Kurt Busch | 4 | 08.3 | 09.4 | 159.07 | 97.1 | 97 | 99 | 981 | 1235 |
| Brad Keselowski | 4 | 08.3 | 10.1 | 158.71 | 99.3 | 48 | 106 | 995 | 1235 |
| Kyle Busch | 4 | 09.5 | 10.5 | 158.91 | 97.1 | 67 | 118 | 892 | 1234 |
| Joey Logano | 4 | 10.3 | 12.4 | 158.74 | 91.3 | 25 | 19 | 900 | 1234 |
| Austin Dillon | 4 | 10.8 | 16.0 | 158.18 | 77.4 | 7 | 0 | 550 | 1235 |
| Alex Bowman | 4 | 11.0 | 08.3 | 159.30 | 102.2 | 85 | 42 | 1076 | 1233 |
| Aric Almirola | 4 | 11.3 | 14.8 | 158.28 | 83.2 | 2 | 0 | 679 | 1234 |
| Denny Hamlin | 4 | 12.0 | 08.0 | 158.42 | 99.7 | 54 | 31 | 1073 | 1224 |
| Matt DiBenedetto | 4 | 13.0 | 16.1 | 157.71 | 74.9 | 4 | 0 | 597 | 1234 |
| Martin Truex Jr | 4 | 13.3 | 10.1 | 159.45 | 104.7 | 139 | 212 | 905 | 1233 |
| Clint Bowyer | 4 | 13.8 | 09.0 | 159.01 | 98.2 | 57 | 72 | 1146 | 1235 |
| Tyler Reddick | 3 | 14.3 | 16.7 | 157.75 | 76.8 | 20 | 0 | 408 | 867 |
| Ryan Newman | 4 | 16.8 | 18.3 | 157.81 | 72.3 | 13 | 5 | 347 | 1233 |
| William Byron | 4 | 18.3 | 13.9 | 158.12 | 85.9 | 20 | 3 | 818 | 1219 |
| Ryan Blaney | 4 | 18.5 | 17.9 | 157.76 | 75.6 | 14 | 0 | 424 | 1233 |
| Chase Elliott | 4 | 20.3 | 08.9 | 158.98 | 98.0 | 85 | 151 | 1055 | 1225 |
| Cole Custer | 3 | 21.7 | 19.9 | 156.85 | 66.1 | 3 | 0 | 208 | 866 |
| Daniel Suarez | 4 | 22.0 | 23.3 | 156.30 | 54.5 | 0 | 1 | 303 | 1230 |
| Christopher Bell | 3 | 23.0 | 22.0 | 156.97 | 60.3 | 3 | 0 | 114 | 850 |
| Chris Buescher | 4 | 23.3 | 20.8 | 157.40 | 61.2 | 14 | 0 | 370 | 1226 |
| Michael McDowell | 4 | 23.5 | 24.5 | 157.03 | 54.3 | 0 | 0 | 34 | 1142 |
| Ryan Preece | 4 | 24.5 | 21.9 | 157.17 | 61.8 | 1 | 0 | 181 | 1094 |
| Bubba Wallace | 4 | 24.8 | 23.4 | 157.34 | 56.8 | 15 | 3 | 90 | 1083 |
| Ricky Stenhouse Jr | 3 | 25.7 | 24.2 | 157.61 | 58.3 | 13 | 0 | 111 | 925 |
| Ross Chastain | 2 | 28.5 | 31.2 | 153.60 | 38.6 | 1 | 0 | 5 | 721 |
| Quin Houff | 3 | 31.0 | 33.8 | 152.06 | 33.8 | 0 | 0 | 0 | 701 |
| Corey LaJoie | 4 | 32.0 | 30.0 | 156.20 | 43.6 | 1 | 0 | 13 | 1060 |
| Josh Bilicki | 2 | 33.0 | 33.9 | 150.25 | 32.3 | 2 | 0 | 0 | 642 |
| Garrett Smithley | 3 | 35.3 | 36.4 | 150.51 | 28.7 | 5 | 0 | 1 | 675 |
| BJ McLeod | 3 | 38.0 | 37.0 | 152.77 | 27.6 | 0 | 0 | 1 | 409 |
| James Davison | 1 | 39.0 | 37.6 | 150.60 | 25.3 | 0 | 0 | 0 | 162 |
2016-2018 Driver Averages At Darlington
| Kevin Harvick | 3 | 05.0 | 04.7 | 159.79 | 119.2 | 82 | 236 | 1082 | 1100 |
| Denny Hamlin | 3 | 05.0 | 06.2 | 159.64 | 112.8 | 74 | 148 | 1095 | 1101 |
| Erik Jones | 2 | 06.5 | 08.2 | 158.71 | 105.7 | 48 | 0 | 712 | 734 |
| Kyle Larson | 3 | 06.7 | 04.8 | 159.88 | 119.7 | 154 | 453 | 1071 | 1100 |
| Martin Truex Jr | 3 | 06.7 | 05.8 | 160.15 | 121.7 | 109 | 134 | 976 | 1101 |
| Kyle Busch | 3 | 06.7 | 07.2 | 159.60 | 101.7 | 32 | 7 | 1091 | 1101 |
| Brad Keselowski | 3 | 08.3 | 06.9 | 159.98 | 111.7 | 70 | 74 | 973 | 1100 |
| Joey Logano | 3 | 08.3 | 07.3 | 159.78 | 103.8 | 30 | 18 | 1075 | 1100 |
| Chase Elliott | 3 | 08.7 | 09.3 | 159.44 | 94.8 | 37 | 0 | 950 | 1100 |
| Austin Dillon | 3 | 10.7 | 14.2 | 158.63 | 82.4 | 11 | 0 | 699 | 1101 |
| Ryan Newman | 3 | 11.3 | 13.0 | 158.73 | 83.8 | 10 | 9 | 780 | 1100 |
| Jamie McMurray | 3 | 11.3 | 12.2 | 158.88 | 84.5 | 6 | 0 | 875 | 1100 |
| Matt Kenseth | 3 | 12.3 | 13.0 | 158.97 | 89.4 | 22 | 10 | 707 | 1098 |
| Jeff Gordon | 1 | 14.0 | 18.8 | 160.75 | 73.6 | 5 | 0 | 108 | 367 |
| Kurt Busch | 3 | 14.3 | 09.2 | 159.26 | 93.0 | 31 | 7 | 1025 | 1060 |
| Chris Buescher | 3 | 15.7 | 17.6 | 158.08 | 70.5 | 5 | 0 | 371 | 1100 |
| Paul Menard | 3 | 16.3 | 18.8 | 158.41 | 71.1 | 5 | 0 | 157 | 1099 |
| Ty Dillon | 2 | 17.0 | 20.4 | 156.83 | 67.4 | 3 | 0 | 128 | 731 |
| Kasey Kahne | 3 | 18.3 | 19.6 | 157.72 | 67.7 | 9 | 0 | 309 | 1095 |
| Carl Edwards | 1 | 19.0 | 11.3 | 161.68 | 82.4 | 2 | 0 | 309 | 366 |
| Ryan Blaney | 3 | 19.7 | 22.2 | 158.58 | 66.8 | 17 | 0 | 111 | 1090 |
| Ricky Stenhouse Jr | 3 | 19.7 | 21.2 | 157.44 | 64.9 | 4 | 0 | 215 | 1092 |
| Regan Smith | 1 | 20.0 | 26.5 | 158.89 | 51.1 | 4 | 0 | 2 | 366 |
| David Ragan | 3 | 21.3 | 25.1 | 156.61 | 52.4 | 19 | 0 | 2 | 1095 |
| Aric Almirola | 3 | 22.0 | 19.7 | 157.68 | 65.0 | 6 | 0 | 175 | 1078 |
| Dale Earnhardt Jr | 1 | 22.0 | 16.4 | 157.72 | 72.1 | 2 | 0 | 139 | 365 |
| Michael McDowell | 3 | 22.0 | 25.3 | 156.84 | 54.0 | 2 | 0 | 11 | 1094 |
| Alex Bowman | 1 | 23.0 | 24.6 | 156.00 | 66.9 | 38 | 0 | 35 | 365 |
| Danica Patrick | 2 | 25.0 | 27.1 | 158.04 | 53.8 | 13 | 0 | 0 | 728 |
| Casey Mears | 1 | 25.0 | 27.8 | 159.27 | 51.3 | 8 | 0 | 0 | 365 |
| Bubba Wallace | 1 | 26.0 | 28.6 | 155.44 | 49.3 | 2 | 0 | 0 | 363 |
| AJ Allmendinger | 3 | 26.3 | 27.7 | 156.25 | 49.5 | 4 | 0 | 2 | 1070 |
| Landon Cassill | 3 | 27.0 | 30.0 | 155.29 | 44.5 | 0 | 5 | 25 | 1083 |
| Corey Lajoie | 2 | 27.5 | 29.3 | 154.61 | 45.5 | 3 | 0 | 1 | 720 |
| Jimmie Johnson | 3 | 28.0 | 21.4 | 158.98 | 72.7 | 21 | 0 | 408 | 921 |
| Ross Chastain | 1 | 28.0 | 31.5 | 153.63 | 41.6 | 1 | 0 | 0 | 360 |
| Michael Annett | 1 | 28.0 | 33.0 | 156.94 | 36.2 | 0 | 0 | 0 | 362 |
| Josh Wise | 1 | 29.0 | 34.5 | 156.39 | 33.2 | 1 | 0 | 0 | 361 |
| Cole Whitt | 2 | 30.0 | 30.3 | 155.30 | 39.2 | 0 | 0 | 2 | 614 |
| Matt DiBenedetto | 3 | 30.3 | 29.5 | 155.79 | 44.1 | 3 | 0 | 0 | 980 |
| JJ Yeley | 1 | 31.0 | 34.4 | 149.66 | 34.2 | 0 | 0 | 0 | 350 |
| BJ McLeod | 1 | 32.0 | 36.2 | 148.08 | 30.1 | 0 | 0 | 0 | 347 |
| Derrike Cope | 2 | 32.5 | 34.8 | 150.37 | 31.4 | 0 | 0 | 2 | 697 |
| Clint Bowyer | 3 | 32.7 | 22.4 | 158.53 | 50.8 | 39 | 0 | 298 | 692 |
| Carl Long | 1 | 33.0 | 33.8 | 150.23 | 34.3 | 2 | 0 | 1 | 350 |
| Daniel Suarez | 2 | 33.5 | 27.5 | 155.89 | 53.3 | 4 | 0 | 33 | 483 |
| Jeffrey Earnhardt | 3 | 34.0 | 33.8 | 153.07 | 33.6 | 5 | 0 | 0 | 947 |
| William Byron | 1 | 35.0 | 12.6 | 155.86 | 67.8 | 2 | 0 | 328 | 329 |
| Tony Stewart | 1 | 35.0 | 16.4 | 161.06 | 65.6 | 0 | 0 | 218 | 317 |
| Reed Sorenson | 2 | 35.0 | 36.5 | 155.31 | 32.2 | 0 | 0 | 1 | 462 |
| Gray Gaulding | 1 | 36.0 | 33.7 | 154.15 | 39.4 | 10 | 0 | 0 | 202 |
| Greg Biffle | 1 | 36.0 | 23.9 | 159.36 | 53.4 | 3 | 0 | 13 | 295 |
| Cody Ware | 1 | 37.0 | 36.4 | 149.91 | 27.0 | 2 | 0 | 0 | 144 |
| Timmy Hill | 1 | 37.0 | 37.3 | 148.86 | 26.2 | 0 | 0 | 0 | 268 |
| Trevor Bayne | 2 | 37.5 | 35.3 | 155.35 | 34.9 | 3 | 0 | 0 | 497 |
| Brian Scott | 1 | 39.0 | 32.9 | 158.21 | 41.2 | 0 | 0 | 0 | 199 |
| Joey Gase | 1 | 40.0 | 38.4 | 148.99 | 26.3 | 0 | 0 | 0 | 120 |
Driver-by-Driver Breakdown Video
Now for the video breakdown! Be sure to go here and subscribe to my YouTube channel if you haven’t already.
Optimal Lineup According to Jordan’s Projections
The optimal FanDuel lineup for FanDuel according to my Projections is:
- Kyle Larson
- Kevin Harvick
- Kyle Busch
- Kurt Busch
- Erik Jones
Confidence Rating = 7.2/10. I think this FanDuel lineup gives you a solid base to work with. I also think the projections are under-valuing Joey Logano a bit this weekend, so I would probably roll with this instead: Kyle Larson, Kevin Harvick, Joey Logano, Kurt Busch, and Tyler Reddick. You could also replace Kevin Harvick with Kyle Busch in that second lineup if you think Rowdy has higher dominator potential than Harvick.
FanDuel “Safe” DFS Picks for Darlington (Cash Lineups)
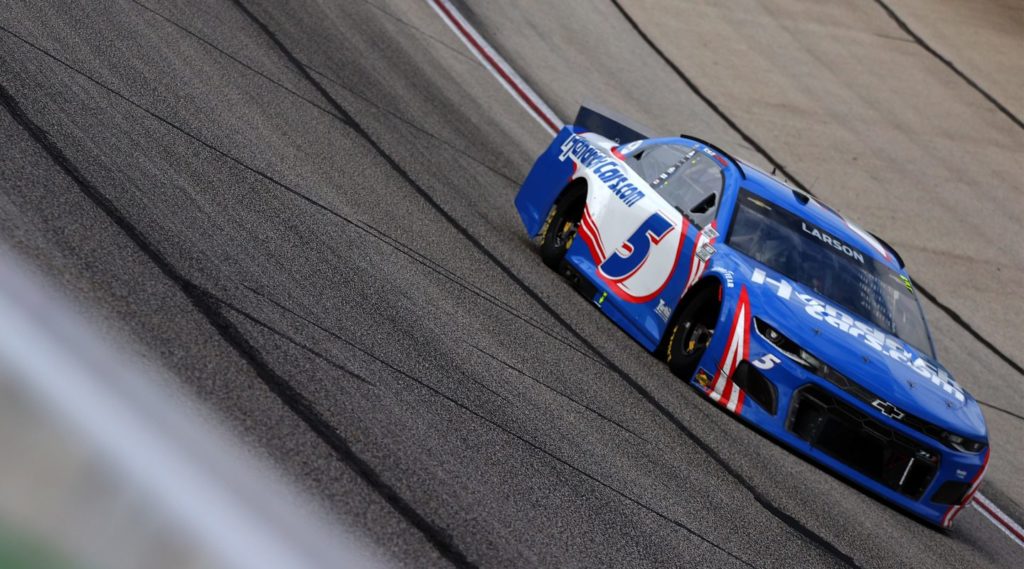
Kyle Larson ($13,000) – For some reason, FanDuel didn’t price up Kyle Larson this weekend and he’s the 3rd-highest-priced driver on the slate. Shew. I could see taking a strategic approach and going underweight in tournaments with Larson (since he’s going to be extremely high-owned), but with cash lineups, you have to roll with this guy. His dominator potential is just too high. In addition to being projected to score the most FanDuel points on Sunday, Larson also has the highest ceiling at 91.70 fantasy points (according to my projections). Larson had an average finish of 6.7 here at Darlington in his Chip Ganassi car, so he should definitely compete for the win with his Hendrick car.
Kurt Busch ($8,500) – It’s now been over three months since Kurt Busch has had a good finish in NASCAR Cup Series action. It’s kind of hard to believe, and it makes him a little risky in NASCAR DFS, but it’s hard to pass up top 10 upside at a $8,500 price tag on FanDuel. Kurt just fits into lineups really well on this site this weekend. The good news about Kurt’s last good finish (at Homestead) is that Goodyear is bringing the same exact tire combination to Darlington this weekend. Also, Kurt is really good here at “The Lady in Black,” with six finishes of 8th or better in his last eight starts here. At this track, we often see the drivers with more talent overcome their equipment restrictions, and that’s what I expect to happen with Kurt Busch this weekend.
FanDuel “Risky” DFS Picks for Darlington (Tournament Lineups)
Austin Dillon ($7,800) – I fully expect plenty of people to be talking about the other Richard Childress Racing driver, Tyler Reddick ($8,000), this weekend, and while my projections do like Reddick quite a bit, I don’t mind pivoting off of him to my boy, Austin Dillon. The #3 Chevrolet will roll off the grid from 9th on Sunday, which makes AD a pretty risky pick due to virtually no place differential potential, but his record here at Darlington is solid: a career average finish of 12.0, no finish worse than 22nd in nine starts, and three top 10s in his last six races here (including a 2nd last September and a 4th back in 2017). Also, Austin came home 12th at Homestead this year and 6th at Atlanta–the other two “high-wear” tracks–and is on a three-race streak of top 10s now after his 10th at Kansas last week. If Reddick hits the wall on Sunday, Dillon could easily be the pivot that is the difference in your lineup.
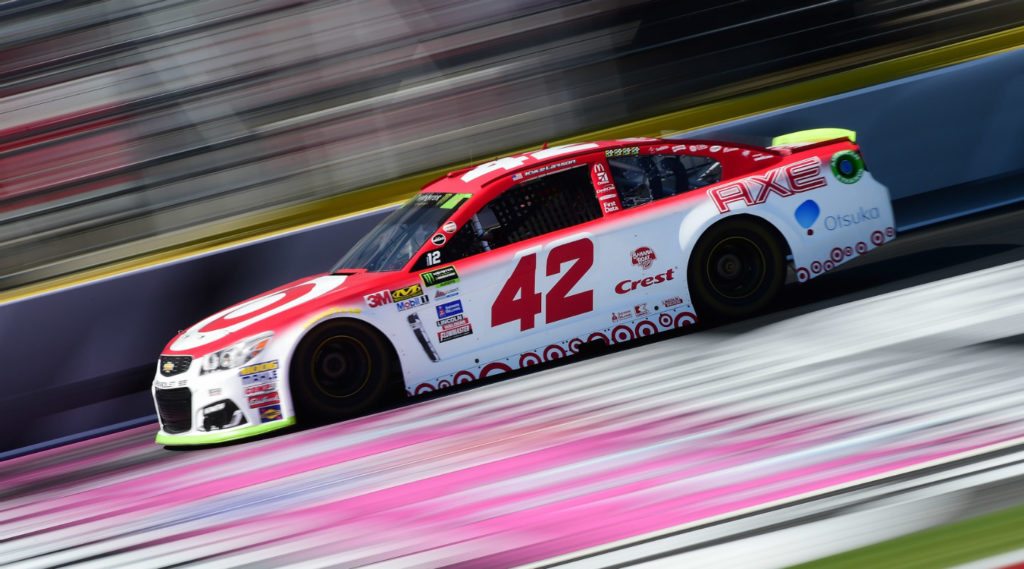
Ross Chastain ($5,200) – Typically it’s best to just avoid rookies at Darlington, but I guess technically Ross Chastain isn’t a rookie this season so that doesn’t really count. He actually does have three Cup Series starts under his belt here at Darlington, with finishes of 28th, 28th, and 29th while running for Premium Motorsports and Spire. Those are actually kind of respectable in my eyes. Additionally, Chastain ran here at Darlington in the Xfinity Series last year, ending up 8th in the first race and then 2nd in the fall race after leading 43 laps. The salary here of $5,200 is what is enticing with Ross Chastain. Him staying on the lead lap and finishing mid-teens–as he’s done in most races this season–allows you to easily fit in a few high-dollar drivers into your lineup and really go for the maximum FanDuel fantasy points up top. Plus, not that it really has much effect, but Chastain is driving that same #42 Chevrolet that Larson was so successful at Darlington with, plus Matt Kenseth finished 10th with it last year as well.
Darlington Goodyear 400 FanDuel Driver Projections
The following chart takes into account the very basics: the starting position and the projected finish of each driver. The projected finishes are averaged from six different ranking systems. Also factored in are projected laps led for each driver. You can click the headers below to sort the chart by that attribute. By default it is sorted by average projected FPTS.
| Driver | FanDuel Salary | Avg Proj Pts | Starting Position | Ceiling Proj Pts | Dollar Per Pt |
|---|---|---|---|---|---|
| Kyle Larson | $13,000 | 79.65 | 14 | 91.70 | $163 |
| Martin Truex Jr. | $13,500 | 71.45 | 4 | 84.70 | $189 |
| Denny Hamlin | $14,000 | 70.05 | 7 | 82.20 | $200 |
| Brad Keselowski | $12,500 | 67.60 | 1 | 81.10 | $185 |
| Kevin Harvick | $10,500 | 67.47 | 2 | 79.90 | $156 |
| Kyle Busch | $10,200 | 67.15 | 3 | 78.70 | $152 |
| Chase Elliott | $12,000 | 65.72 | 6 | 76.30 | $183 |
| Alex Bowman | $11,000 | 65.55 | 19 | 74.10 | $168 |
| Joey Logano | $10,000 | 64.70 | 12 | 71.00 | $155 |
| Kurt Busch | $8,500 | 63.80 | 17 | 70.40 | $133 |
| Christopher Bell | $9,000 | 60.30 | 21 | 70.70 | $149 |
| William Byron | $11,500 | 59.85 | 5 | 79.00 | $192 |
| Erik Jones | $7,300 | 59.70 | 26 | 75.80 | $122 |
| Aric Almirola | $7,500 | 58.70 | 27 | 70.30 | $128 |
| Tyler Reddick | $8,000 | 58.55 | 10 | 72.30 | $137 |
| Ryan Blaney | $9,500 | 58.55 | 16 | 63.90 | $162 |
| Austin Dillon | $7,800 | 57.25 | 9 | 65.40 | $136 |
| Ryan Newman | $6,000 | 56.45 | 20 | 66.80 | $106 |
| Ricky Stenhouse Jr. | $5,500 | 56.20 | 28 | 63.30 | $98 |
| Matt DiBenedetto | $8,200 | 51.95 | 8 | 64.80 | $158 |
| Cole Custer | $6,500 | 51.10 | 24 | 56.80 | $127 |
| Chris Buescher | $7,000 | 50.20 | 11 | 60.80 | $139 |
| Ryan Preece | $4,500 | 49.35 | 29 | 59.30 | $91 |
| Bubba Wallace | $5,800 | 48.35 | 23 | 51.80 | $120 |
| Michael McDowell | $6,200 | 47.70 | 13 | 61.80 | $130 |
| Ross Chastain | $5,200 | 47.60 | 18 | 58.30 | $109 |
| Corey LaJoie | $4,000 | 45.00 | 30 | 49.30 | $89 |
| Daniel Suarez | $6,700 | 44.35 | 15 | 58.30 | $151 |
| Justin Haley | $3,000 | 43.50 | 31 | 48.30 | $69 |
| Chase Briscoe | $5,000 | 42.60 | 22 | 57.30 | $117 |
| Anthony Alfredo | $4,000 | 39.75 | 25 | 46.80 | $101 |
| J.J. Yeley | $2,000 | 39.65 | 34 | 43.80 | $50 |
| B.J. McLeod | $2,000 | 37.80 | 32 | 39.80 | $53 |
| Josh Bilicki | $2,500 | 37.20 | 37 | 45.30 | $67 |
| James Davison | $2,000 | 36.45 | 36 | 41.80 | $55 |
| Cody Ware | $2,500 | 34.70 | 33 | 38.80 | $72 |
| Quin Houff | $2,500 | 34.35 | 35 | 39.80 | $73 |


