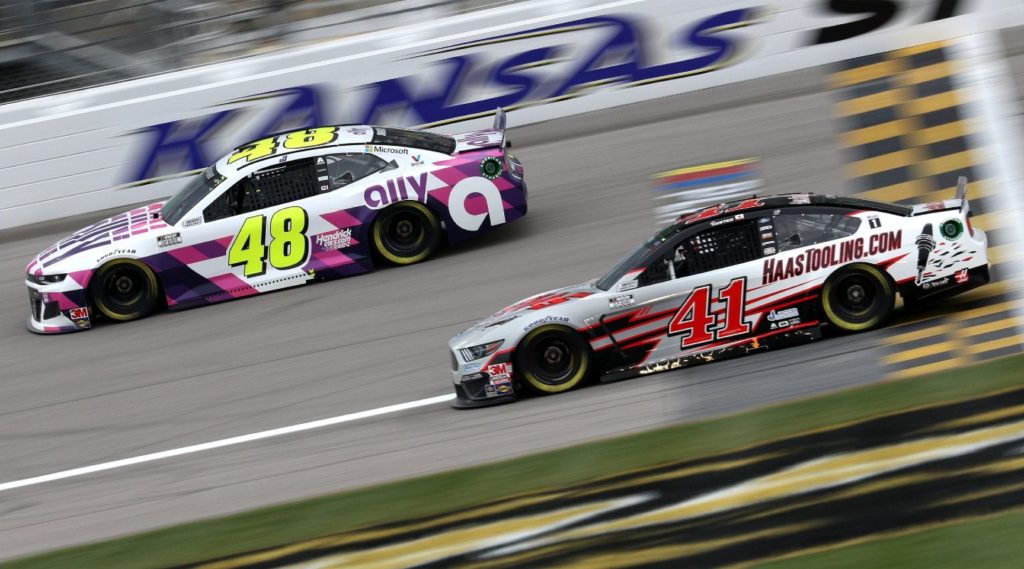
The NASCAR Cup Series heads to Kansas Speedway for the Buschy McBusch Race 400 this weekend on Sunday afternoon. As of Friday, the weather forecast at Kansas looks pretty clear for Sunday, but you know how things get when NASCAR rolls into town. Last week’s winner, Brad Keselowski, and William Byron will lead them to the green this weekend and you can see the full starting lineup by clicking here. Now let’s goooo!!!!
Enjoy the FREE content that this site offers each week? Consider donating to support by clicking here. Also, be sure to check out the Algorithm Predicted Finishing Order for this race by clicking here!
“Low-Wear” Intermediate Track Speed Report & Loop Data Driver Averages
We’re at a “low-wear” 1.5-mile track this weekend with Kansas Speedway. This will technically be the fourth 1.5-mile race of the season–Homestead, Las Vegas, and Atlanta–but Homestead and Atlanta are kind of in their own category because of the “high-wear” designation. So really we have just one race of data to look at strongly for this season (Las Vegas). Click here for Green Flag Speed from Vegas, and click here for the full Loop Data Box Score.
Below you will also find charts for 2020 “low-wear” 1.5-mile track data. Those races include two races here at Kansas, two races at Charlotte, two races at Las Vegas, two races at Texas, and then one race at Kentucky.
Also included is a chart for the last two years of Kansas races. I combined the last two years because that is the time frame of NASCAR using this package. Most drivers have four Kansas starts over that time frame. The following statistics are included in these charts. You can click on column headers to sort by that column.
- Starts
- Finish
- ARP = average running position
- DR = driver rating
- FL = fastest laps (total)
- LL = laps led (total)
- T15 = laps ran inside top 15 (total)
- Total Laps = laps completed (total)
2020 Driver Averages on Low-Wear Intermediate Tracks
| Brad Keselowski | 9 | 06.4 | 10.2 | 97.3 | 110 | 108 | 2025 | 2617 |
| Kevin Harvick | 9 | 07.2 | 09.2 | 106.9 | 186 | 328 | 2141 | 2616 |
| Ryan Blaney | 9 | 07.7 | 06.2 | 114.2 | 236 | 225 | 2433 | 2616 |
| Kyle Larson | 1 | 09.0 | 09.9 | 95.9 | 5 | 0 | 249 | 267 |
| Martin Truex Jr | 9 | 09.4 | 08.3 | 105.9 | 208 | 257 | 2170 | 2603 |
| Kyle Busch | 9 | 10.8 | 10.9 | 96.1 | 127 | 172 | 2012 | 2616 |
| Joey Logano | 9 | 11.0 | 08.8 | 105.6 | 68 | 219 | 2133 | 2526 |
| Kurt Busch | 9 | 11.8 | 11.9 | 91.4 | 77 | 85 | 2040 | 2546 |
| Denny Hamlin | 9 | 12.1 | 15.1 | 90.2 | 144 | 247 | 1534 | 2609 |
| Matt DiBenedetto | 9 | 12.6 | 12.5 | 88.2 | 22 | 40 | 1824 | 2525 |
| Austin Dillon | 9 | 13.6 | 12.8 | 84.6 | 20 | 23 | 1892 | 2594 |
| Chase Elliott | 9 | 13.9 | 08.8 | 103.6 | 226 | 257 | 2095 | 2615 |
| Alex Bowman | 9 | 14.9 | 08.7 | 100.2 | 178 | 269 | 2207 | 2600 |
| Aric Almirola | 9 | 14.9 | 14.7 | 84.6 | 90 | 164 | 1475 | 2615 |
| Cole Custer | 9 | 15.7 | 18.8 | 72.0 | 21 | 5 | 837 | 2502 |
| Erik Jones | 9 | 15.9 | 14.5 | 80.4 | 63 | 9 | 1451 | 2615 |
| Tyler Reddick | 9 | 16.0 | 15.5 | 75.8 | 43 | 5 | 1460 | 2505 |
| Christopher Bell | 9 | 16.9 | 17.8 | 72.2 | 42 | 5 | 939 | 2601 |
| William Byron | 9 | 17.7 | 12.6 | 85.5 | 86 | 57 | 1834 | 2534 |
| Ryan Newman | 8 | 19.9 | 20.5 | 62.0 | 11 | 1 | 471 | 2328 |
| Chris Buescher | 9 | 20.3 | 21.1 | 65.1 | 22 | 10 | 537 | 2507 |
| Ricky Stenhouse Jr | 9 | 21.1 | 20.6 | 68.1 | 20 | 31 | 581 | 2289 |
| Corey LaJoie | 9 | 22.1 | 24.8 | 52.0 | 8 | 1 | 162 | 2607 |
| Michael McDowell | 9 | 22.3 | 23.7 | 55.2 | 5 | 1 | 254 | 2591 |
| Ty Dillon | 9 | 22.6 | 24.7 | 53.7 | 3 | 0 | 155 | 2537 |
| Ross Chastain | 2 | 24.5 | 20.1 | 64.2 | 8 | 0 | 149 | 668 |
| Daniel Suarez | 9 | 26.3 | 28.7 | 44.4 | 4 | 0 | 20 | 2590 |
| Bubba Wallace | 9 | 27.1 | 23.9 | 55.1 | 4 | 0 | 290 | 1957 |
| Ryan Preece | 9 | 29.1 | 24.2 | 52.8 | 1 | 1 | 85 | 2252 |
| Josh Bilicki | 7 | 32.0 | 34.4 | 33.0 | 9 | 0 | 3 | 1842 |
| James Davison | 1 | 32.0 | 34.5 | 34.2 | 0 | 0 | 0 | 258 |
| Quin Houff | 9 | 32.6 | 33.9 | 34.1 | 2 | 0 | 1 | 2496 |
| Joey Gase | 9 | 34.6 | 36.1 | 28.8 | 4 | 0 | 1 | 2145 |
| BJ McLeod | 4 | 35.0 | 34.7 | 30.7 | 1 | 0 | 8 | 980 |
| Timmy Hill | 9 | 35.3 | 35.5 | 29.4 | 14 | 0 | 5 | 2051 |
2019-2020 Driver Averages At Kansas
| Chase Elliott | 4 | 06.0 | 07.3 | 170.95 | 108.4 | 66 | 97 | 1006 | 1082 |
| Alex Bowman | 4 | 06.0 | 10.7 | 170.37 | 101.0 | 61 | 76 | 801 | 1082 |
| Brad Keselowski | 4 | 06.5 | 07.8 | 170.84 | 106.5 | 71 | 50 | 898 | 1082 |
| Kevin Harvick | 4 | 07.0 | 07.7 | 171.09 | 116.1 | 125 | 198 | 952 | 1082 |
| Denny Hamlin | 4 | 08.3 | 09.3 | 170.84 | 110.6 | 75 | 268 | 791 | 1081 |
| Erik Jones | 4 | 08.8 | 10.7 | 170.77 | 98.7 | 59 | 0 | 875 | 1082 |
| Martin Truex Jr | 4 | 09.3 | 09.6 | 170.94 | 103.2 | 72 | 77 | 813 | 1081 |
| Cole Custer | 2 | 10.5 | 15.8 | 169.22 | 79.6 | 3 | 0 | 274 | 534 |
| William Byron | 4 | 10.8 | 12.6 | 170.35 | 88.4 | 31 | 35 | 688 | 1081 |
| Kyle Larson | 2 | 11.0 | 10.0 | 171.42 | 99.1 | 45 | 60 | 435 | 548 |
| Kyle Busch | 4 | 12.3 | 09.0 | 171.05 | 101.0 | 101 | 57 | 899 | 1079 |
| Clint Bowyer | 4 | 13.3 | 12.5 | 170.18 | 87.0 | 15 | 12 | 806 | 1081 |
| Aric Almirola | 4 | 13.5 | 14.0 | 170.29 | 83.8 | 11 | 0 | 718 | 1079 |
| Kurt Busch | 4 | 14.5 | 12.3 | 170.09 | 90.3 | 11 | 9 | 837 | 1012 |
| Tyler Reddick | 3 | 15.7 | 15.1 | 170.21 | 79.1 | 18 | 0 | 463 | 804 |
| Christopher Bell | 2 | 16.5 | 15.6 | 169.43 | 78.0 | 4 | 0 | 283 | 531 |
| Joey Logano | 4 | 17.0 | 14.7 | 171.11 | 89.3 | 17 | 78 | 686 | 990 |
| Austin Dillon | 4 | 18.8 | 18.4 | 169.17 | 68.8 | 2 | 0 | 363 | 1065 |
| Chris Buescher | 4 | 19.3 | 18.3 | 170.02 | 69.6 | 4 | 10 | 312 | 997 |
| Ryan Blaney | 4 | 20.0 | 09.5 | 170.46 | 93.1 | 62 | 17 | 788 | 1074 |
| Ricky Stenhouse Jr | 4 | 20.8 | 16.2 | 171.07 | 72.3 | 9 | 12 | 397 | 873 |
| Michael McDowell | 4 | 21.3 | 24.8 | 167.76 | 54.5 | 4 | 0 | 73 | 1077 |
| Daniel Suarez | 4 | 22.8 | 21.3 | 168.15 | 61.1 | 11 | 6 | 268 | 1073 |
| Corey LaJoie | 4 | 23.5 | 26.2 | 167.63 | 51.2 | 3 | 1 | 65 | 1075 |
| Matt DiBenedetto | 4 | 24.8 | 18.6 | 170.22 | 68.6 | 1 | 12 | 358 | 980 |
| Ryan Preece | 4 | 25.0 | 24.3 | 168.85 | 55.7 | 1 | 0 | 57 | 989 |
| Ryan Newman | 4 | 28.3 | 22.9 | 168.84 | 52.9 | 5 | 1 | 144 | 859 |
| Ross Chastain | 2 | 29.0 | 30.6 | 167.16 | 42.1 | 1 | 1 | 17 | 540 |
| Bubba Wallace | 4 | 29.8 | 23.7 | 169.37 | 54.9 | 1 | 0 | 60 | 969 |
| Garrett Smithley | 2 | 30.0 | 34.1 | 159.65 | 36.8 | 2 | 0 | 0 | 527 |
| Quin Houff | 3 | 30.3 | 33.8 | 162.20 | 35.1 | 0 | 0 | 0 | 781 |
| Josh Bilicki | 3 | 32.0 | 34.8 | 160.18 | 33.2 | 4 | 0 | 0 | 776 |
| James Davison | 1 | 32.0 | 34.5 | 165.22 | 34.2 | 0 | 0 | 0 | 258 |
| BJ McLeod | 1 | 39.0 | 39.2 | 156.13 | 23.8 | 0 | 0 | 0 | 66 |
DraftKings Strategy & Dominators for Kansas
Optimal lineup construction on Sunday is going to come down to which drivers dominate and for how long. It’s not crazy to see several “mini” dominators at these “low-wear” 1.5-mile tracks as opposed to one or two main dominators. That has an even higher potential to happen this weekend with all of the place differential plays as well. Putting together the optimal DraftKings lineup, in my opinion, is going to come down to balancing the place differential plays with the higher starters/dominators. Things to remember:
- There are 267 laps scheduled for Sunday’s Buschy McBusch Race 400 at Kansas, which means there are 66.75 DraftKings FPTS up for grabs for those laps led. Additionally, you can expect right around 220 green flag laps, giving us an additional 99 (approximately) DraftKings FPTS up for grabs for fastest laps.
- Kansas is typically a 2-3 main dominator race, with a couple of other “mini” dominators thrown into the mix as well. Looking back at the Las Vegas race from earlier this year, we had Larson as the main dominator, and then Chase Elliott, William Byron, Brad Keselowski, and Denny Hamlin all led 20+ laps as well. In With fastest laps, Larson had 57 while William Byron and Brad Keselowski added in 31 and 30 (respectively).
- Goodyear is bringing similar tires that were used on “low-wear” 1.5-mile tracks last season, but never this specific combination. Here’s what is being used:
Dominators
These are the potential dominators for Sunday’s race at Kansas, and are listed in the order of likelihood according to my projections:
- Brad Keselowski
- Denny Hamlin
- Kyle Larson
- Martin Truex, Jr.
- Ryan Blaney
- Kyle Busch
- William Byron
- Alex Bowman
- Chase Elliott
Some “surprise” dominators that could happen on Sunday include: Christopher Bell, Joey Logano, Kevin Harvick, and Tyler Reddick.
Driver-by-Driver Breakdown Video
Now for the video breakdown! Be sure to go here and subscribe to my YouTube channel if you haven’t already.
Optimal Lineup According to Jordan’s Projections
The optimal DraftKings lineup for Kansas according to my Projections is:
- Kyle Larson
- Denny Hamlin
- Kyle Busch
- Austin Cindric
- Ross Chastain
- Chris Buescher
Confidence Rating = 8.7/10. I love this lineup and love the construction of it. I think this gives you a great base to work with and then you can pivot off of certain drivers and work others in. I have no problem entering this exact lineup into contests, and I’ll be doing so in at least one high-dollar contest this weekend.
GPP / Tournament Picks
Chase Elliott ($10,400) – This is setting up to be a perfect storm of Chase Elliott being under-owned in DraftKings at one of his best tracks. Yes, he’s been disappointing for fantasy owners this season, and I’ll be honest, that kind of concerns me this week, but let me explain why I like Chase on Sunday. First, it’s the strategy play. With his “struggles” (and I use that term loosely) this season, many DraftKings players are going to gravitate toward the other five high-priced drivers on the slate this weekend, especially since Chase starts the 2nd-highest of the six. Another reason I really like Chase on Sunday? Go back and watch the Las Vegas race: he had the best car early. Unfortunately, the #JordanJinx hit him that race. Sorry, I apologize. But still, Chase had 19 fastest laps and 22 laps led before his pit crew ruined the car that day. Here at Kansas, Elliott has the best average finish, the best average running position, and the 6th-most fastest laps since the start of 2019. He’s also led 40+ laps in three of his last five starts here, including a win back in 2018.
Ryan Blaney ($9,500) – My projections have Ryan Blaney at around 25% owned here on Sunday, but I have a hunch the actual number will be a little less than that. And, as always on “low-wear” 1.5-mile tracks, I like being overweight on Ryan Blaney. For whatever reason, a lot of DraftKings players still haven’t taken into account that Blaney is really, really good at this track type. He led the series in fastest laps at this track type last season and also had the 3rd-best average finish. At Kansas, Blaney has a pretty weak record, but that’s because bad luck just seems to bite him here a lot. Still, over the last four races at this track, he has 62 total fastest laps, and he should be a top 5 threat here on Sunday. For what it’s worth, Ryan Blaney has finished 4th or better in 12 of the last 16 Stages here at Kansas.
Kyle Busch ($8,600) – Most of us have been waiting for the “old” Kyle Busch to come back, and each and every week we’re disappointed. But it has to happen sometime, right? Well, this weekend I not only love Kyle Busch’s price on DraftKings, but I actually think he has some dominator potential as well. Remember back at the rain delayed Texas race last year when he led 90 laps and won, kind of out of nowhere? I’m thinking that happens again, although at this salary, there’s a chance Kyle Busch doesn’t come “out of nowhere.” Still, it’s hard to imagine his ownership being super high on Sunday. Anyway, one stat that I absolutely love with Rowdy this weekend is his fastest laps here at Kansas: 101 over the last four races, which is 2nd-best in the series. That’s significant because Kyle Busch’s fastest laps have dropped majorly since NASCAR put in this new racing package. So the fact that Rowdy has been able to get those fastest laps here at Kansas is noteworthy for sure. As far as his record at Kansas, Busch led 52 laps in the first race here last season and has top 5 finishes in eight of his last twelve starts here. He also has just one finish worse than 11th here since the 2014 season.
Cash Core Drivers
Kyle Larson ($11,300) – Can you trust Kyle Larson this week? You could always pivot to Joey Logano ($11,100) with your cash core, but Larson has higher upside both in place differential as well as dominating potential on Sunday. If we look at the 1.5-mile track races this season, Kyle Larson finished 4th at Homestead, led 103 laps and won at Las Vegas, and then dominated Atlanta and finished 2nd. Obviously the closest race to Kansas between those three is Vegas (by a wide margin), but it’s still noteworthy. Larson starts 32nd on Sunday and needs a good run to get his season back on track. In his Chip Ganassi car, he’s finished between 3rd and 8th in four of his last six starts at this track and led 60+ laps in two of the last four. Larson’s on track to put up another huge DraftKings score this weekend.
Denny Hamlin ($10,800) – Yep, loading up the studs in cash this week. Denny Hamlin starting 20th is a gold mine at pretty much any track, but here at Kansas, he’s led 57+ laps in each of the last three races and won two of them. Cha ching! Dennis also has the 3rd-most fastest laps over the last two years at this track–which is a statistical category he doesn’t really excel at much on these intermediate tracks–and he’s 2nd in that category thus far during the 2021 NASCAR Cup Series season. For what it’s worth, my algorithm has Hamlin predicted to finish 2nd here at Kansas on Sunday.
Austin Cindric ($6,700) – Do I even have to explain this one? For those new to DraftKings: Austin Cindric starts 38th, and he gets one fantasy point per position he moves up on the track, plus points for finishing position. At a salary of just $6,700, he has to be in your cash lineup this weekend. I can see taking a strategic approach and being underweight in tournaments, but not in cash lineups. All Cindric has to do is not wreck and he’s going to hit value at this price point. He’s averaging 35.3 DraftKings FPTS per race this year, and to hit that number he just has to finish around 22nd here on Sunday. That’s right about where my projections have Cindric.
Kansas Buschy McBusch Race 400 DraftKings Driver Projections
The following chart takes into account the very basics: the starting position and the projected finish of each driver. The projected finishes are averaged from six different ranking systems. Also factored in are projected laps led and fastest laps for each driver. You can click the headers below to sort the chart by that attribute. By default it is sorted by average projected FPTS.
| Driver | DraftKings Salary | Avg Proj FPTS | Proj Ownership | Starting Position | Ceiling Proj FPTS | Avg. Projected Finish | Dollar Per FPT |
|---|---|---|---|---|---|---|---|
| Kyle Larson | $11,300 | 87.67 | 37.30% | 32 | 120.70 | 04.7 | $129 |
| Denny Hamlin | $10,800 | 74.83 | 31.03% | 20 | 112.00 | 06.0 | $144 |
| Martin Truex Jr | $10,000 | 66.33 | 32.49% | 15 | 82.75 | 04.3 | $151 |
| Joey Logano | $11,100 | 64.98 | 20.45% | 29 | 92.20 | 06.7 | $171 |
| Brad Keselowski | $9,700 | 63.75 | 30.23% | 1 | 108.20 | 04.5 | $152 |
| Alex Bowman | $10,200 | 59.47 | 27.67% | 25 | 88.35 | 08.5 | $172 |
| Chase Elliott | $10,400 | 56.28 | 25.06% | 17 | 76.00 | 06.0 | $185 |
| Ryan Blaney | $9,500 | 55.98 | 24.53% | 7 | 90.95 | 04.8 | $170 |
| Kyle Busch | $8,600 | 55.18 | 27.38% | 9 | 84.00 | 06.2 | $156 |
| Kurt Busch | $9,300 | 46.07 | 19.81% | 28 | 56.35 | 12.8 | $202 |
| William Byron | $8,800 | 39.98 | 10.22% | 2 | 70.00 | 09.5 | $220 |
| Erik Jones | $7,800 | 39.53 | 22.94% | 27 | 46.75 | 16.7 | $197 |
| Christopher Bell | $8,000 | 39.17 | 8.54% | 8 | 52.45 | 10.2 | $204 |
| Ricky Stenhouse Jr | $8,200 | 38.18 | 15.69% | 23 | 74.30 | 15.2 | $215 |
| Kevin Harvick | $9,100 | 36.67 | 9.42% | 4 | 71.00 | 07.5 | $248 |
| Austin Cindric | $6,700 | 36.17 | 66.39% | 38 | 50.90 | 22.7 | $185 |
| Aric Almirola | $8,400 | 28.67 | 12.66% | 18 | 39.30 | 16.3 | $293 |
| Ross Chastain | $6,500 | 26.23 | 29.94% | 24 | 37.55 | 20.8 | $248 |
| Tyler Reddick | $6,900 | 25.65 | 7.21% | 11 | 36.05 | 16.2 | $269 |
| Chris Buescher | $6,100 | 24.95 | 16.70% | 16 | 45.90 | 18.2 | $244 |
| Matt DiBenedetto | $7,700 | 23.57 | 4.91% | 5 | 32.90 | 12.8 | $327 |
| Austin Dillon | $7,500 | 19.67 | 14.63% | 6 | 35.60 | 15.0 | $381 |
| Daniel Suarez | $6,300 | 17.83 | 20.34% | 21 | 45.15 | 24.0 | $353 |
| Bubba Wallace | $7,200 | 17.68 | 7.54% | 13 | 34.20 | 20.3 | $407 |
| Chase Briscoe | $6,000 | 13.50 | 10.24% | 19 | 24.25 | 24.2 | $444 |
| Justin Haley | $5,100 | 13.50 | 5.24% | 31 | 21.90 | 29.8 | $378 |
| Corey Lajoie | $5,500 | 13.33 | 10.70% | 26 | 24.10 | 27.5 | $413 |
| Garrett Smithley | $5,400 | 11.67 | 2.52% | 36 | 27.25 | 32.8 | $463 |
| Cole Custer | $7,100 | 11.00 | 8.65% | 10 | 18.35 | 20.7 | $645 |
| Matt Mills | $5,300 | 10.33 | 5.10% | 39 | 25.00 | 35.0 | $513 |
| Anthony Alfredo | $4,500 | 10.17 | 18.99% | 22 | 22.50 | 27.5 | $443 |
| Josh Bilicki | $5,000 | 09.83 | 4.89% | 37 | 28.00 | 34.5 | $508 |
| BJ McLeod | $4,800 | 09.50 | 1.19% | 30 | 15.35 | 31.2 | $505 |
| Ryan Newman | $7,400 | 08.50 | 6.68% | 14 | 17.90 | 23.2 | $871 |
| Ryan Preece | $5,600 | 08.50 | 3.81% | 12 | 19.10 | 23.3 | $659 |
| Quin Houff | $4,600 | 07.50 | 1.20% | 34 | 13.90 | 34.3 | $613 |
| Cody Ware | $4,700 | 05.00 | 1.38% | 33 | 10.95 | 34.7 | $940 |
| Joey Gase | $4,900 | 04.83 | 2.74% | 35 | 17.00 | 35.7 | $1,014 |
| Michael McDowell | $5,800 | 00.50 | 4.30% | 3 | 20.85 | 22.8 | $11,600 |


