It’s Bristol, Baby! We’re back with another Saturday night race this weekend (the final one of the season), and it’s also the cutoff race between the first two Rounds of the Playoffs. So there’s definitely lots on the line this weekend.
Bristol is a half-mile bull ring track, and one mistake can ruin a driver’s night in a hurry. No other tracks compare super well to Bristol, but if you wanted to throw in high-banked venues, such as Darlington, Dover, Homestead, Las Vegas, that’d be the way to go. I’ve always used Dover as somewhat of a comparison because it’s smaller in size as well, but even then, that track is double the length of Bristol.
Brad Keselowski is on the pole for Saturday night’s race at Bristol and if you need to see the full starting lineup, you can do so by clicking here. Now let’s get into it!
NEWS: Denny Hamlin, Kyle Busch, and Erik Jones all failed inspection and will start from the rear on Saturday night. They will be scored from their original starting spots, and it lowers their dominator potential a little bit.
Speed Report in 2020 After Richmond
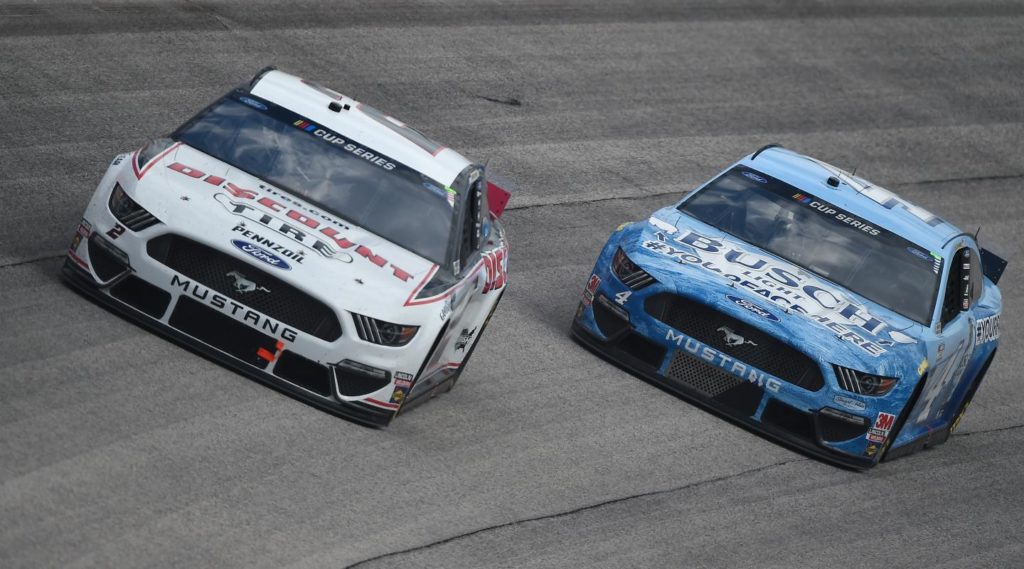
I’ll say this: if Rodney Childers and the #4 team keeps giving Kevin Harvick this fast of race cars, he’s definitely winning the 2020 NASCAR Cup Series Championship. Not only does Harvick have the best Green Flag Speed average all season long, but with his “win” in this statistical category at Richmond last weekend, he now has absolutely insane average rank of 1.8 over the last six relevant races. For reference, the next best on that list is Martin Truex, Jr. with a 6.0 average.
Over the last six races here are the fastest drivers in terms of Green Flag Speed:
- Kevin Harvick (2.8 average rank)
- Martin Truex, Jr. (6.0 average rank)
- Denny Hamlin (6.2 average rank)
- Chase Elliott (7.0 average rank)
- Joey Logano (7.8 average rank)
You can click here to check out the updated Cheat Sheet on Green Flag Speed and see how every driver ranks in that category plus more, not only for the last six races but for the whole season.
DraftKings Strategy for Bristol
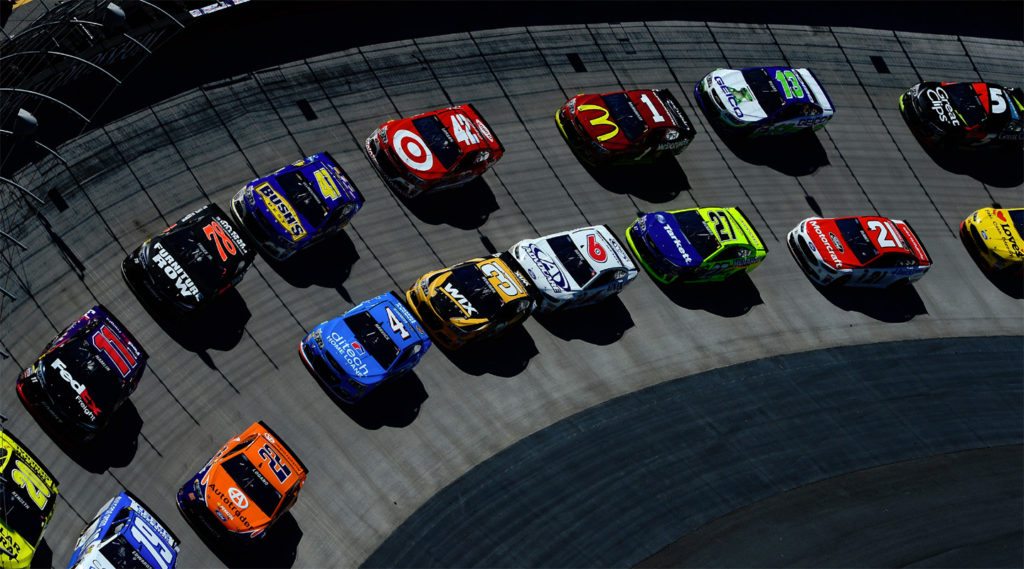
PLEASE NOTE: In this section I compare Bristol and Richmond quite a bit, however, it’s more so explaining how dominator points are typically distributed at these tracks because they’re very similar. The two tracks themselves aren’t similar at all, so please don’t take it as that.
It’s actually probably kind of a good thing we have Bristol back-to-back with Richmond because the strategy is similar. This is going to be a two to three dominator race, and you need to nail those guys. The breakdowns for fastest laps and lap led at these two tracks is also very similar (you’ll see below). The main difference here is that Bristol is a half-mile track, and accidents/issues are much more likely to occur than at Richmond. This opens the door to play those super cheap drivers, as they will move up due to attrition, as long as they run a clean race. If all six of your DraftKings drivers on Saturday night don’t have any issues, you’ll probably be looking pretty solid on the Leaderboard.
Looking back to the first points-paying Cup race here at Bristol this season, 11 cars didn’t finish the race due to accidents, including five of the current Playoff contenders. That is another item you have to keep in mind as well this weekend–how teams may play this race to try and steal Stage points for their Playoff chances. Going back to accidents and cautions, though, note that a typical Bristol race is under the green flag for 84% of the scheduled distance, which would equal 420 laps here on Saturday night since the scheduled distance is 500 laps.
In total, we’re looking at 335 DraftKings dominator FPTS up for grabs on Saturday night–125 for laps led, and around 210 for fastest laps.
On to the typical Bristol fastest lap breakdown. If you remember back to Richmond last weekend, I told you that fastest laps were going to be extremely spread out. What happened? In all, 31 drivers posted at least one fastest lap last Saturday night. You can expect the same thing to happen here at Bristol this weekend. The breakdowns for fastest laps between these two tracks are extremely similar. Here’s how the top 3 drivers in that category usually stack up:
- Driver with most fastest laps = 19.25% of the total
- Driver with 2nd-most fastest laps = 13.54% of the total
- Driver with 3rd-most fastest laps = 9.72% of the total
Unlike the last couple of races this season, there is not a strong correlation between laps led and fastest laps at Bristol. This is, in part, due to the fact that the leader will be the first to encounter lapped traffic, and will always be fighting that. Only one time in the past seven Bristol races has the driver with the most laps led also had the most fastest laps. Here’s how the typical breakdown for the top 3 drivers in laps led goes:
- Driver with most laps led = 34.47% of the total
- Driver with 2nd-most laps led = 24.87% of the total
- Driver with 3rd-most laps led = 17.10% of the total
Also worth noting: only one time in the last five Bristol races has the driver that had the most laps led started inside the top 5. Earlier this season, Brad Keselowski started on the pole and won the race, but it was Denny Hamlin who led the most laps that day, and he started 10th.
GPP / Tournament Picks I Love for the Bass Pro Shops NRA Night Race at Bristol
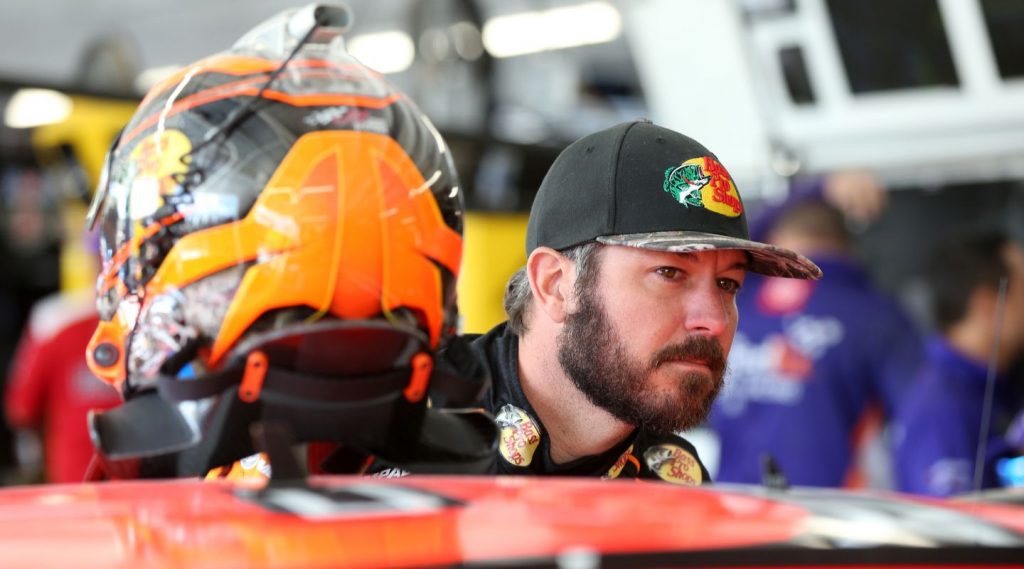
Martin Truex, Jr. ($10,000) – I fall into this trap every single time we come to Bristol, and every single time I regret it. But damn, a guy’s bad luck at this track can only last so long…right? Martin Truex, Jr., by all intents and purposes, is awful at Bristol. Awful. I’m talking an average finish of 20.6, with just THREE top 10s in 29 career starts. For reference, the guy should’ve had three top 10s at Darlington this season alone! But here’s the thing: he’s usually fast here. Over the last eight Bristol events, Truex is averaging the 3rd-most fastest laps (31.6 per race), and in last year’s fall race here he had the most fastest laps (52) in addition to leading quite a few as well (ironically, also 52). A few weeks ago, Truex broke his bad run streak at Daytona with a top 5 finish, and maybe lightning will strike twice. I’ve lost money in DraftKings going heavy on worse drivers.
Ryan Blaney ($8,800) – Earlier this week, Ryan Blaney was going to be one of my Cash Core write-ups, but then I noticed through a few Twitter exchanges that more than a few people think he sucks at Bristol. Pair that with how crappy the #12 Ford has been to start out the Playoffs and we could see recency bias take down Blaney’s ownership quite a bit on Saturday night. But here’s the thing: this car will be fast enough to contend for the win. Blaney starts 14th so there’s place differential potential there. Over the last five Bristol races, he has the most laps led, the 3rd-best average running position, and the 5th-most fastest laps. In the regular season Bristol race back in May, Blaney finished dead last, but don’t forget he led 60 laps that day and was running 2nd when he spun out and Ty Dillon plowed into him. Blaney needs a great run here on Saturday night to keep his Championship hopes alive. All he needs is to avoid the bad luck.
JJ Yeley ($4,600) – I hinted at this earlier… don’t be afraid to really dip down in the bucket this week. DraftKings priced the contenders aggressively for Saturday night’s race, so this type of strategy may very well be needed. Anyway, let’s talk about JJ Yeley. I got excited when news broke that he was running the #15 Chevrolet this weekend, and even more excited when DraftKings priced him the same as Brennan Poole. This Premium Motorsports car is basically the best of the back markers in my mind, and Yeley has shown this whole season that he can out-perform his equipment. That #27 Ford has no business running top 30, yet Yeley has more top 30s this year than finishes outside of that range. Brennan Poole drove this #15 car to a 24th-place finish in the first Bristol race this season, while Yeley was 25th in that race in the junk #7 Chevrolet for Tommy Baldwin Racing. Honestly, I don’t mind going up to 30% Yeley ownership on Saturday night.
Cash Core Drivers I Love for the Bass Pro Shops NRA Night Race at Bristol
Kyle Busch ($10,400) – Among the high-priced race win contenders on Saturday night, Kyle Busch starts the furthest back and he’s also priced as one of the lowest in the group. *Insert lock being locked sound*. Bristol has been Kyle Busch’s playground in the past, as he’s an 8-time winner here and has led nearly 2,500 laps in his career here. That’s almost as many as the next two active drivers combined. Additionally, Rowdy is a fastest lap king at this track, averaging the most (56.5 per race) over the last four August night races, while also having the most here back in May. Kyle also led 100 laps in that race.
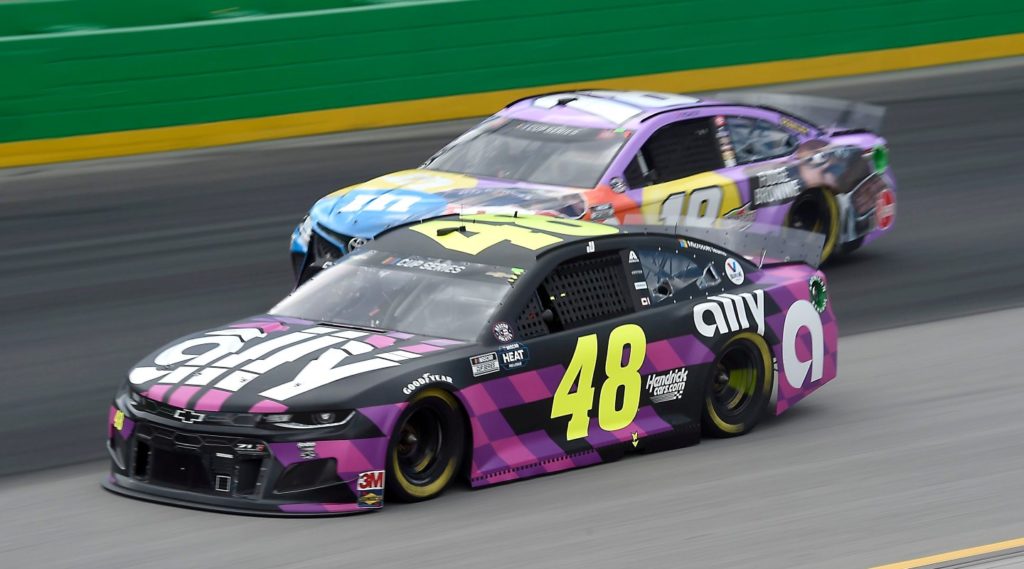
Jimmie Johnson ($8,600) – Every single race at Bristol, it seems like DraftKings under-prices Jimmie Johnson. Maybe that’s just my weird brain thinking that, but it sure seems like it. Anyway, Johnson will start back in 24th on Saturday night and is a legitimate top 10 threat. There’s a ton of value in this mid-$8,000 range and Johnson is the best cash play among them. He finished 3rd here in the regular season race–where he ironically also started 24th–and has seven top 11 results in the last eight races in Thunder Valley. The only downside with JJ this weekend is that he really doesn’t put up many fastest laps at Bristol, but he could end up with more than average with how this #48 Chevrolet is running. Also, that’s what the place differential is for.
John Hunter Nemechek ($6,400) – Another under-priced driver. John Hunter Nemechek has had a knack for getting through high-attrition races cleanly this season, as he not only finished 13th here at Bristol back in May, but also has finished 11th or better in all three superspeedway races this year. This weekend, Nemechek will start back in 31st for the Bass Pro Shops NRA Night Race, and just on speed alone he should be able to run mid-to-upper 20s. In cash games, this one is a no-brainer.
Bass Pro Shops NRA Night Race at Bristol DraftKings Projections
The following chart takes into account the very basics: the starting position and the projected finish of each driver. The projected finishes are averaged from five different ranking systems. Also included are projected laps led and fastest laps for each driver. You can click the headers below to sort the chart by that attribute. By default it is sorted by average projected FPTS.
| Driver | Starting Position | DraftKings Salary | Avg Proj FPTS | Avg. Projected Finish | Proj Laps Led | Proj Fastest Laps | Dollar Per FPT |
|---|---|---|---|---|---|---|---|
| Chase Elliott | 6 | $10,700 | 88.0 | 04.7 | 76 | 54 | $122 |
| Kyle Busch | 9 | $10,400 | 87.8 | 04.3 | 69 | 49 | $119 |
| Denny Hamlin | 7 | $12,000 | 81.0 | 03.8 | 84 | 34 | $148 |
| Kevin Harvick | 4 | $11,600 | 73.8 | 04.3 | 50 | 44 | $157 |
| Brad Keselowski | 1 | $11,200 | 66.8 | 06.2 | 61 | 35 | $168 |
| Ryan Blaney | 14 | $8,800 | 62.2 | 09.2 | 30 | 25 | $142 |
| Jimmie Johnson | 24 | $8,600 | 59.3 | 08.0 | 0 | 14 | $145 |
| Erik Jones | 20 | $9,400 | 54.9 | 10.2 | 5 | 19 | $171 |
| Martin Truex Jr | 3 | $10,000 | 53.6 | 07.5 | 33 | 30 | $187 |
| Joey Logano | 2 | $9,700 | 52.7 | 05.7 | 40 | 16 | $184 |
| Clint Bowyer | 11 | $8,400 | 50.8 | 06.7 | 11 | 10 | $166 |
| William Byron | 15 | $7,900 | 44.3 | 12.2 | 5 | 14 | $179 |
| Kurt Busch | 13 | $9,100 | 39.8 | 11.2 | 6 | 6 | $228 |
| Ricky Stenhouse Jr | 21 | $7,600 | 38.3 | 16.3 | 0 | 9 | $198 |
| Matt Kenseth | 19 | $6,300 | 37.5 | 16.2 | 0 | 12 | $168 |
| Ryan Newman | 25 | $7,300 | 35.3 | 18.3 | 0 | 2 | $207 |
| Alex Bowman | 8 | $7,400 | 34.9 | 11.7 | 9 | 7 | $212 |
| Aric Almirola | 10 | $8,200 | 34.2 | 13.7 | 4 | 13 | $240 |
| Matt DiBenedetto | 16 | $8,100 | 32.4 | 16.7 | 7 | 3 | $250 |
| Austin Dillon | 5 | $7,800 | 32.3 | 12.0 | 10 | 8 | $241 |
| Bubba Wallace | 27 | $6,800 | 31.5 | 21.2 | 0 | 1 | $216 |
| Chris Buescher | 23 | $6,000 | 30.8 | 18.8 | 0 | 2 | $195 |
| Christopher Bell | 18 | $7,100 | 29.5 | 17.5 | 0 | 2 | $241 |
| John H. Nemechek | 31 | $6,400 | 28.7 | 23.5 | 0 | 1 | $223 |
| Tyler Reddick | 17 | $6,600 | 24.7 | 19.0 | 0 | 2 | $268 |
| Cole Custer | 12 | $6,900 | 23.8 | 17.2 | 0 | 2 | $290 |
| Michael McDowell | 26 | $5,900 | 23.3 | 24.0 | 0 | 1 | $253 |
| Ty Dillon | 28 | $6,100 | 23.2 | 25.2 | 0 | 1 | $263 |
| Ryan Preece | 22 | $5,700 | 21.5 | 22.8 | 0 | 1 | $265 |
| Corey Lajoie | 30 | $5,500 | 20.3 | 27.2 | 0 | 1 | $270 |
| JJ Yeley | 32 | $4,600 | 19.3 | 29.0 | 0 | 1 | $238 |
| Timmy Hill | 38 | $5,200 | 18.8 | 31.8 | 0 | 0 | $276 |
| Daniel Suarez | 29 | $5,400 | 18.5 | 27.3 | 0 | 1 | $292 |
| Gray Gaulding | 37 | $5,100 | 18.3 | 31.5 | 0 | 0 | $278 |
| Garrett Smithley | 40 | $5,300 | 17.3 | 33.7 | 0 | 0 | $306 |
| Quin Houff | 33 | $4,500 | 14.2 | 31.5 | 0 | 0 | $318 |
| Josh Bilicki | 39 | $4,800 | 13.8 | 34.3 | 0 | 0 | $347 |
| Reed Sorenson | 34 | $5,000 | 12.0 | 32.8 | 0 | 0 | $417 |
| Joey Gase | 36 | $4,900 | 10.7 | 34.8 | 0 | 0 | $459 |
| James Davison | 35 | $4,700 | 06.5 | 36.3 | 0 | 0 | $723 |


