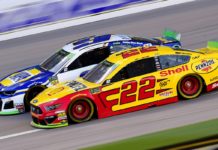
The Monster Energy NASCAR Cup Series is at Chicagoland Speedway this weekend for the Overton’s 400. We race at this track once per season, but 2018 is the first time since 2010 that we’ve been here in July. Apparently NASCAR realized that this race is so boring that it’s not a very good fit for the first event of the Playoffs. Anyway, Chicagoland is your typical 1.5-mile track, and up until Saturday evening, this was shaping up to be a pretty typical weekend. And then all hell broke loose. NASCAR decided to go with their idiotic condensed schedule for this race weekend, and after a very late qualifying session on Saturday (they qualified at the same time the race will be close to finished on Sunday), we had four drivers (Martin Truex, Jr., Denny Hamlin, Jimmie Johnson, and Chris Buescher) fail post-qualifying inspection and have their times disallowed. They will start and be scored from the rear on Sunday. That is in addition to Kevin Harvick, Kyle Busch, and Kyle Larson all missing the final round of qualifying, and if all of that is any indication of what’s going to happen on race day, we’re bound to have three crazy weeks in a row because Daytona is up next. Isn’t Fantasy NASCAR fun?
I’ll be skipping out on the “Driver Targets” this week, as there is so much chalk on the board. Full projections are listed below. Good luck!
FanDuel Projections for the Overton’s 400
The following chart takes into account the very basics: the starting position and the projected finish of each driver. The projected finishes are averaged from five different ranking systems, using both mathematical equations as well as personal rankings. This chart also includes the average projected base points + laps led as well as the dollar per FPT. It assumes that all drivers projected to finish 11th or better will complete all laps, those projected 11th-16th will finish 2 laps down, those projected 17th-24th will finish 4 laps down, those projected 25th-30th will finish 6 laps down, and those projected 31st or worse will finish 8 laps down. You can click the headers below to sort the chart by that attribute. By default it is sorted by average projected FPTS.
| Driver | FanDuel Salary | Avg Proj FPTS | Starting Position | Avg. Projected Finish | Proj Laps Led | Dollar Per FPT |
|---|---|---|---|---|---|---|
| Martin Truex Jr. | $12,800 | 88.6 | 36 | 02.8 | 53 | $144 |
| Kevin Harvick | $12,300 | 76.2 | 11 | 02.2 | 47 | $161 |
| Denny Hamlin | $10,600 | 74.1 | 37 | 08.8 | 11 | $143 |
| Kyle Larson | $11,400 | 72.1 | 18 | 04.8 | 24 | $158 |
| Kyle Busch | $11,900 | 71.9 | 16 | 04.0 | 18 | $166 |
| Ryan Blaney | $10,500 | 65.2 | 2 | 05.6 | 49 | $161 |
| Joey Logano | $10,800 | 64.9 | 12 | 06.0 | 2 | $166 |
| Jimmie Johnson | $9,500 | 64.6 | 38 | 14.6 | 0 | $147 |
| Chase Elliott | $10,600 | 63.4 | 3 | 05.8 | 27 | $167 |
| Brad Keselowski | $11,100 | 59.2 | 7 | 08.0 | 0 | $188 |
| Clint Bowyer | $11,200 | 59.2 | 5 | 07.8 | 7 | $189 |
| Kurt Busch | $10,400 | 58.3 | 4 | 08.4 | 12 | $178 |
| Erik Jones | $9,300 | 54.0 | 9 | 12.0 | 0 | $172 |
| Aric Almirola | $8,400 | 53.4 | 6 | 11.6 | 3 | $157 |
| Chris Buescher | $6,100 | 52.9 | 39 | 22.6 | 0 | $115 |
| Daniel Suarez | $8,200 | 51.8 | 10 | 13.8 | 0 | $158 |
| Alex Bowman | $8,100 | 50.2 | 15 | 16.4 | 0 | $161 |
| Ricky Stenhouse Jr. | $8,000 | 50.0 | 20 | 18.2 | 0 | $160 |
| Paul Menard | $8,700 | 49.9 | 1 | 13.0 | 14 | $174 |
| Jamie McMurray | $9,100 | 49.5 | 13 | 16.2 | 0 | $184 |
| Austin Dillon | $7,400 | 48.5 | 14 | 17.2 | 0 | $153 |
| Ryan Newman | $7,600 | 47.3 | 17 | 19.0 | 0 | $161 |
| William Byron | $7,300 | 47.0 | 8 | 16.2 | 0 | $155 |
| Bubba Wallace | $7,000 | 45.6 | 22 | 21.8 | 0 | $154 |
| Kasey Kahne | $7,900 | 44.8 | 24 | 23.0 | 0 | $176 |
| Ty Dillon | $6,500 | 44.7 | 25 | 23.4 | 0 | $145 |
| AJ Allmendinger | $7,800 | 41.4 | 19 | 23.6 | 0 | $188 |
| Corey LaJoie | $5,000 | 39.9 | 32 | 28.8 | 0 | $125 |
| Trevor Bayne | $6,600 | 39.5 | 21 | 25.4 | 0 | $167 |
| Michael McDowell | $6,000 | 38.4 | 26 | 27.8 | 0 | $156 |
| Matt DiBenedetto | $6,300 | 37.0 | 28 | 29.4 | 0 | $170 |
| David Ragan | $6,800 | 36.3 | 23 | 28.2 | 0 | $187 |
| Ross Chastain | $5,000 | 33.9 | 27 | 31.0 | 0 | $147 |
| Gray Gaulding | $5,000 | 33.1 | 29 | 32.2 | 0 | $151 |
| Landon Cassill | $5,500 | 32.6 | 31 | 33.2 | 0 | $169 |
| Kyle Weatherman | $5,000 | 30.6 | 30 | 34.2 | 0 | $163 |
| Reed Sorenson | $5,000 | 30.2 | 34 | 35.8 | 0 | $166 |
| Timmy Hill | $5,000 | 29.2 | 35 | 36.8 | 0 | $171 |


